Free Access
Fig. 8.
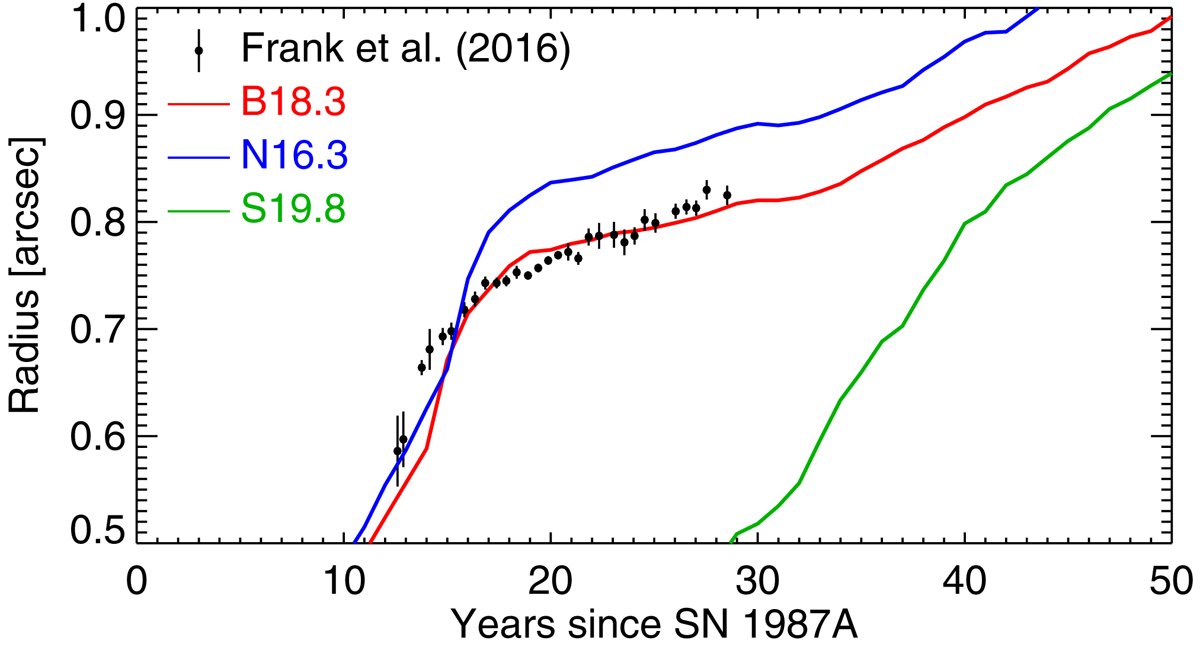
Best-fit radius of the X-ray emitting torus vs time inferred from the analysis of actual X-ray observations (symbols; Frank et al. 2016) and that derived from the analysis of synthetic X-ray images for models B18.3 (red solid line), N16.3 (blue), and S19.8 (green).
Current usage metrics show cumulative count of Article Views (full-text article views including HTML views, PDF and ePub downloads, according to the available data) and Abstracts Views on Vision4Press platform.
Data correspond to usage on the plateform after 2015. The current usage metrics is available 48-96 hours after online publication and is updated daily on week days.
Initial download of the metrics may take a while.