Fig. 6.
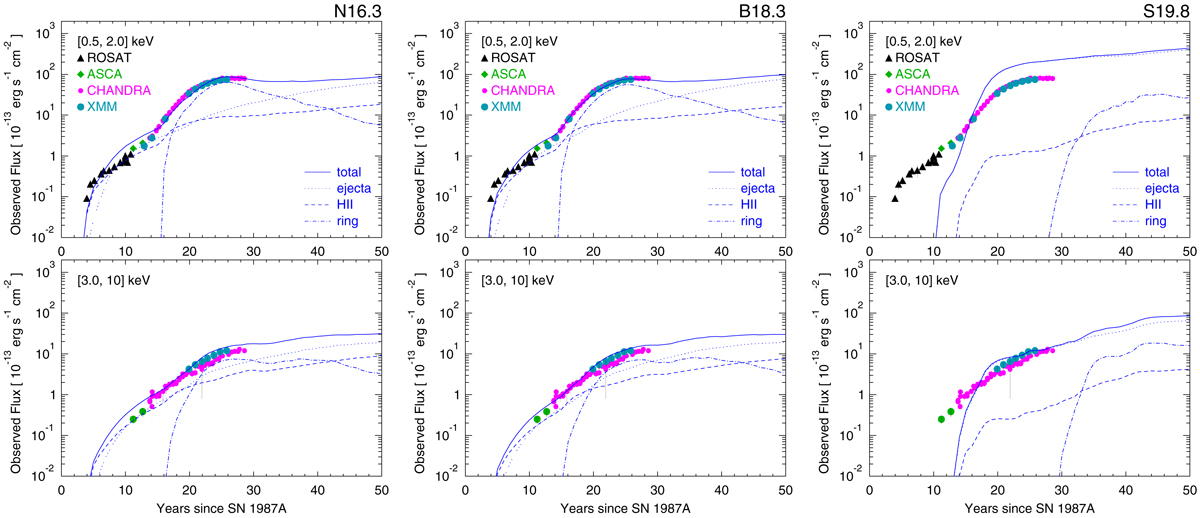
X-ray lightcurves (solid lines) in the [0.5, 2] keV (upper panels) and [3, 10] keV (lower panels) bands synthesized from models N16.3 (left panels), B18.3 (center panels), and S19.8 (right panels) compared to the lightcurves of SN 1987A observed with Rosat (black triangles; Haberl et al. 2006), ASCA (green diamonds; Orlando et al. 2015), Chandra (magenta circles; Helder et al. 2013; Frank et al. 2016) and XMM-Newton (cyan circles; Haberl et al. 2006; Maggi et al. 2012). Dotted, dashed, and dot-dashed lines indicate the contribution to emission from the shocked ejecta, the shocked plasma from the H II region, and the shocked plasma from the ring, respectively.
Current usage metrics show cumulative count of Article Views (full-text article views including HTML views, PDF and ePub downloads, according to the available data) and Abstracts Views on Vision4Press platform.
Data correspond to usage on the plateform after 2015. The current usage metrics is available 48-96 hours after online publication and is updated daily on week days.
Initial download of the metrics may take a while.