Fig. 4.
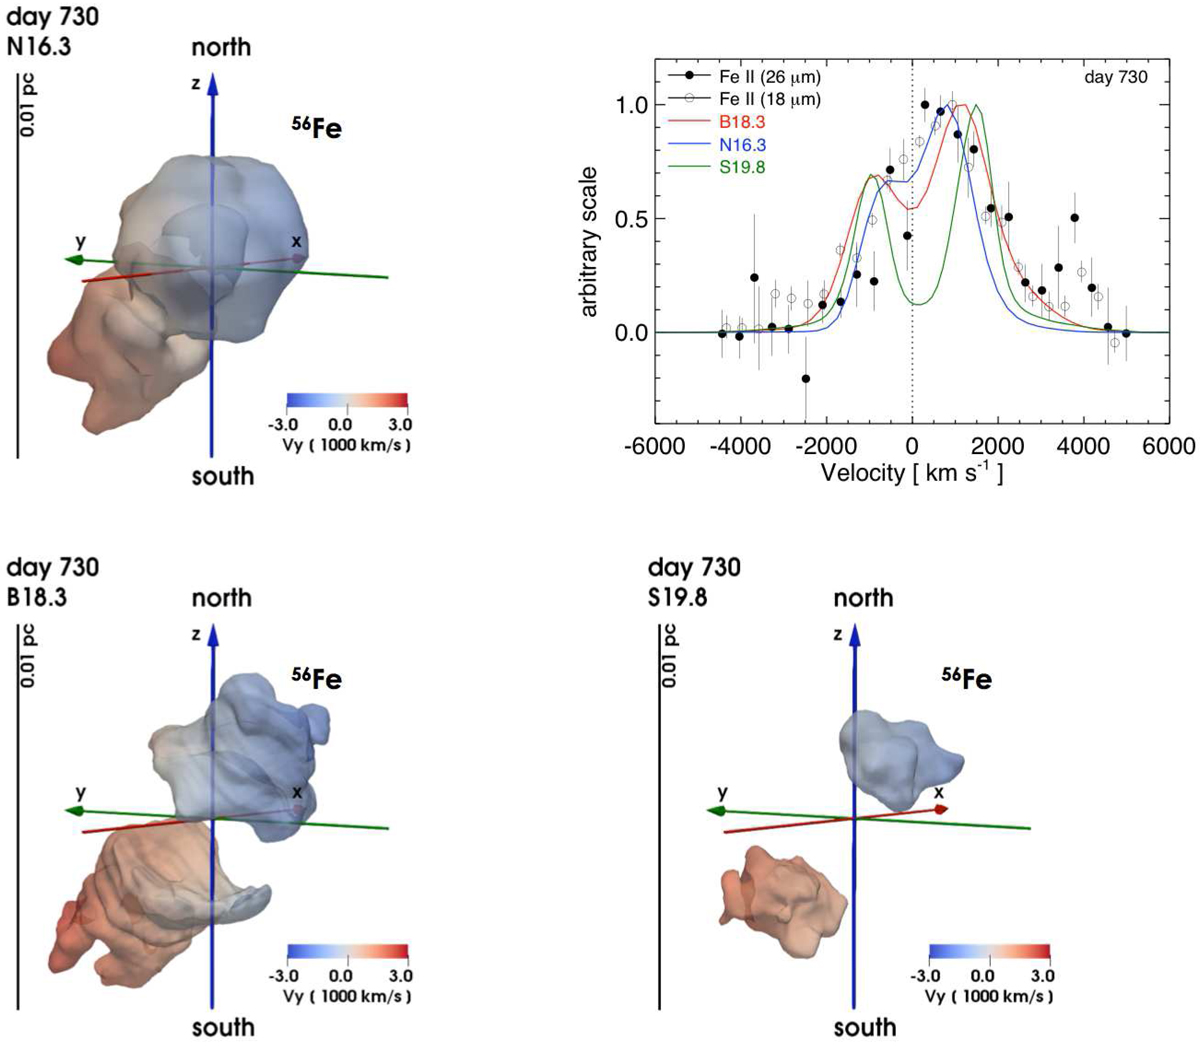
Isosurfaces of the iron distribution for models N16.3 (upper left panel), B18.3 (lower left), and S19.8 (lower right) at day 730. The semi-transparent isosurfaces correspond to a value of the iron density which is at 10% of the peak density for each model (maximum iron density is 4.9 × 10⁻¹⁶ g cm−3 for N16.3, 6.0 × 10⁻¹⁶ g cm−3 for B18.3, and 1.1 × 10⁻¹⁵ g cm−3 for S19.8). The colors give the velocity along the LoS in units of 1000 km s−1 on the isosurface; the color coding is defined at the bottom of each panel. The yardstick indicating the length scale is on the left. The upper right panel shows the line profiles of [Fe II] 26 μm and 18 μm of SN 1987A observed during the first 2 years of evolution (symbols; Haas et al. 1990) and synthesized from models N16.3, B18.3, and S19.8 at day 730 (solid lines). See online Movie 1 for an animation of these data; a navigable 3D graphic of the iron distribution for the three models is available at https://skfb.ly/6P7sH.
Current usage metrics show cumulative count of Article Views (full-text article views including HTML views, PDF and ePub downloads, according to the available data) and Abstracts Views on Vision4Press platform.
Data correspond to usage on the plateform after 2015. The current usage metrics is available 48-96 hours after online publication and is updated daily on week days.
Initial download of the metrics may take a while.