Fig. 13.
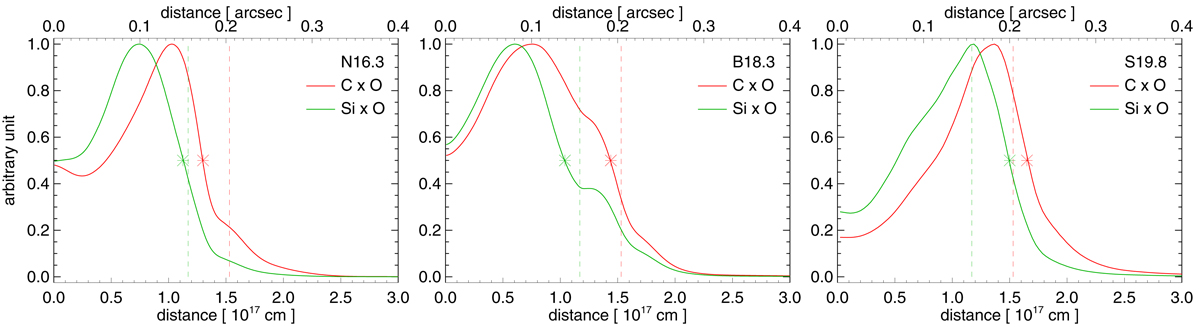
Average radial distribution of C×O (red curve) and Si×O (green) from the axis of the torus-like structure at day 9875 for models N16.3, B18.3, and S19.8. Symbols indicate the extension of the C×O (red stars) and Si×O (green stars) structures at 50% of the peak of the profiles; vertical dashed lines show the maximum extension of CO (red) and SiO (green) inferred from ALMA observations (Abellán et al. 2017).
Current usage metrics show cumulative count of Article Views (full-text article views including HTML views, PDF and ePub downloads, according to the available data) and Abstracts Views on Vision4Press platform.
Data correspond to usage on the plateform after 2015. The current usage metrics is available 48-96 hours after online publication and is updated daily on week days.
Initial download of the metrics may take a while.