Fig. 10.
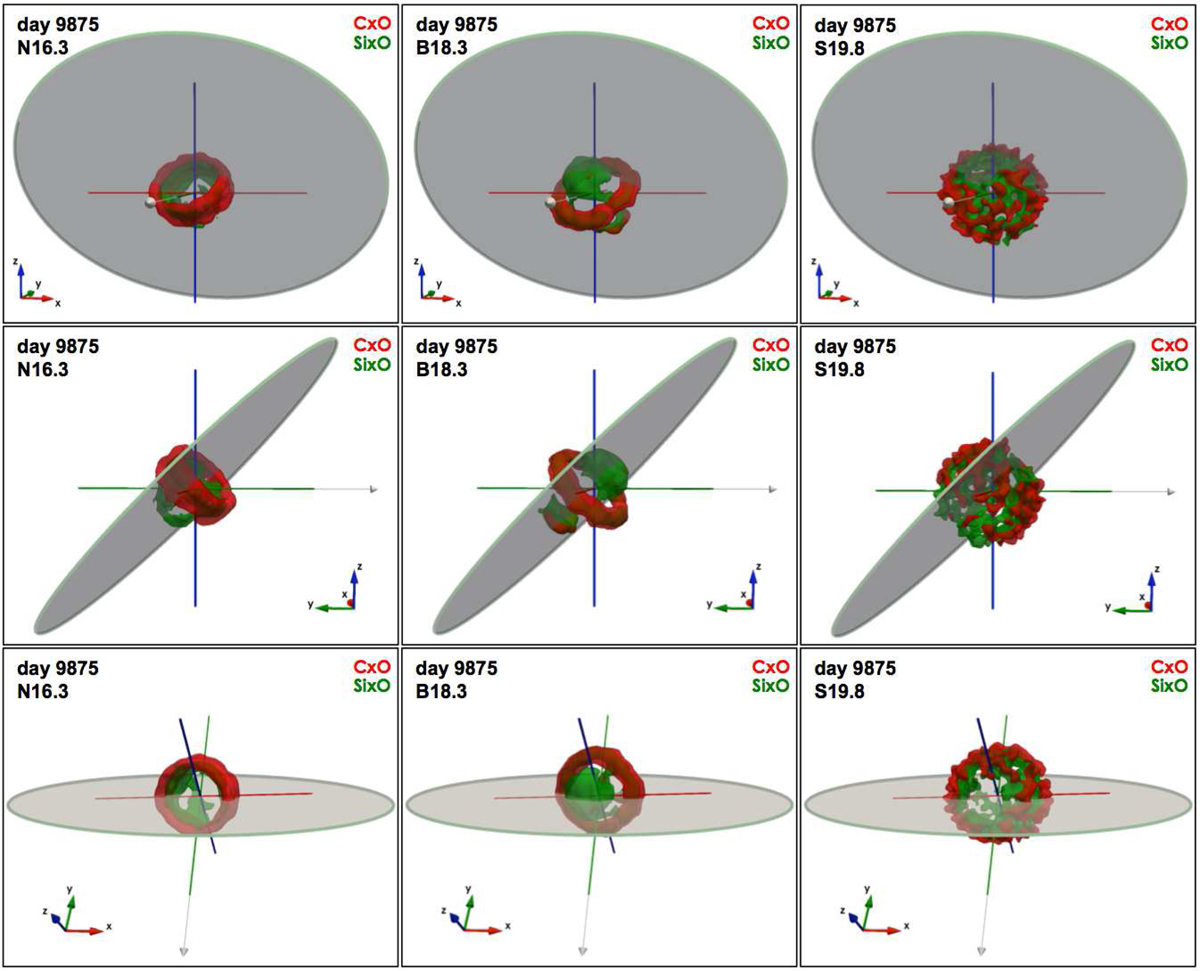
Isosurfaces of the distributions of C×O (red) and Si×O (green) at day 9875 from selected view angles for models N16.3 (left panels), B18.3 (center panels), and S19.8 (right panels). The semi-transparent isosurfaces correspond to a value of density which is at 50% of the respective peak density (maximum density is 1.3 × 10⁻¹⁹ g cm−3, 3.2 × 10⁻¹⁹ g cm−3, and 1.9 × 10⁻¹⁹ g cm−3 for Si×O and 9.9 × 10⁻²⁰ g cm−3, 4.3 × 10⁻¹⁹ g cm−3, and 1.3 × 10⁻¹⁹ g cm−3 for C×O, for models N16.3, B18.3, and S19.8 respectively). The gray arrow lying on the y axis indicate the position of the observer. The ring indicates the position of the dense inner ring. See online Movie 6 for an animation of these data; a navigable 3D graphic of the C×O and Si×O distributions for the three models is available at https://skfb.ly/6P7sI.
Current usage metrics show cumulative count of Article Views (full-text article views including HTML views, PDF and ePub downloads, according to the available data) and Abstracts Views on Vision4Press platform.
Data correspond to usage on the plateform after 2015. The current usage metrics is available 48-96 hours after online publication and is updated daily on week days.
Initial download of the metrics may take a while.