Fig. 3
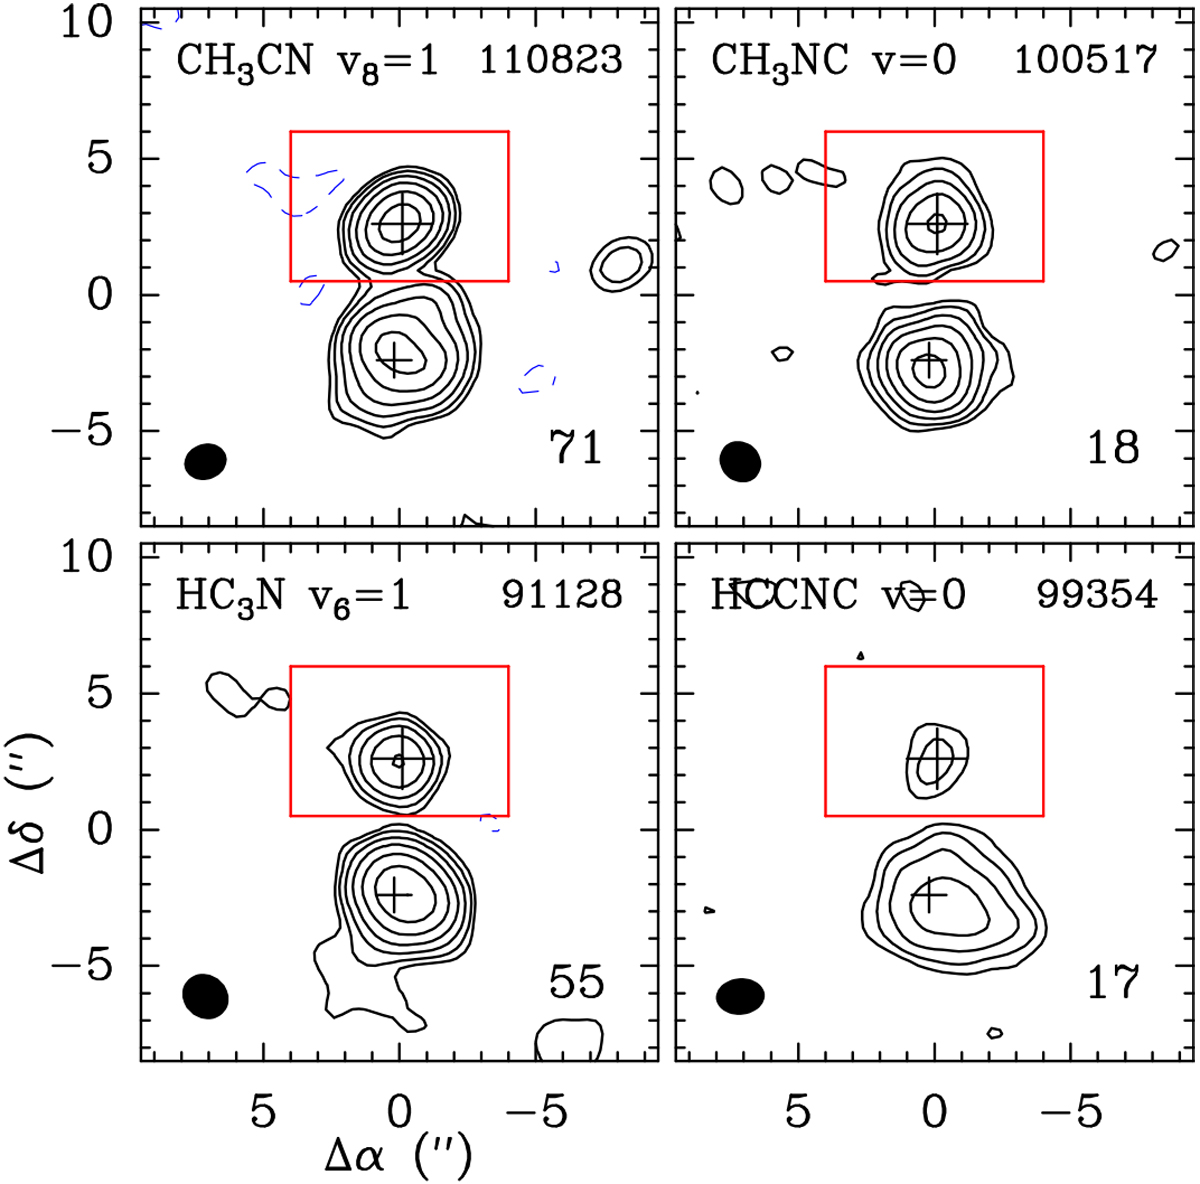
Integrated intensity maps of CH3CN, CH3NC, HC3N, and HCCNC. In each panel, the name of the molecule followed by the vibrational state of the line is written in the top left corner, the line frequency in MHz is given in the top right corner, the rms noise level σ in mJy beam−1 km s−1 is written in the bottom right corner, and the beam (HPBW) is shown in the bottom left corner. The black contour levels start at 3σ and then increase geometrically by a factor of two at each step. The blue, dashed contours show the −3σ level. The large and small crosses indicate the positions of the hot molecular cores Sgr B2(N2) and Sgr B2(N1), respectively.Because of the variation in systemic velocity across the field, the assignment of the detected emission to each molecule is valid only for the region around Sgr B2(N2), highlighted with the red box.
Current usage metrics show cumulative count of Article Views (full-text article views including HTML views, PDF and ePub downloads, according to the available data) and Abstracts Views on Vision4Press platform.
Data correspond to usage on the plateform after 2015. The current usage metrics is available 48-96 hours after online publication and is updated daily on week days.
Initial download of the metrics may take a while.