Fig. 3
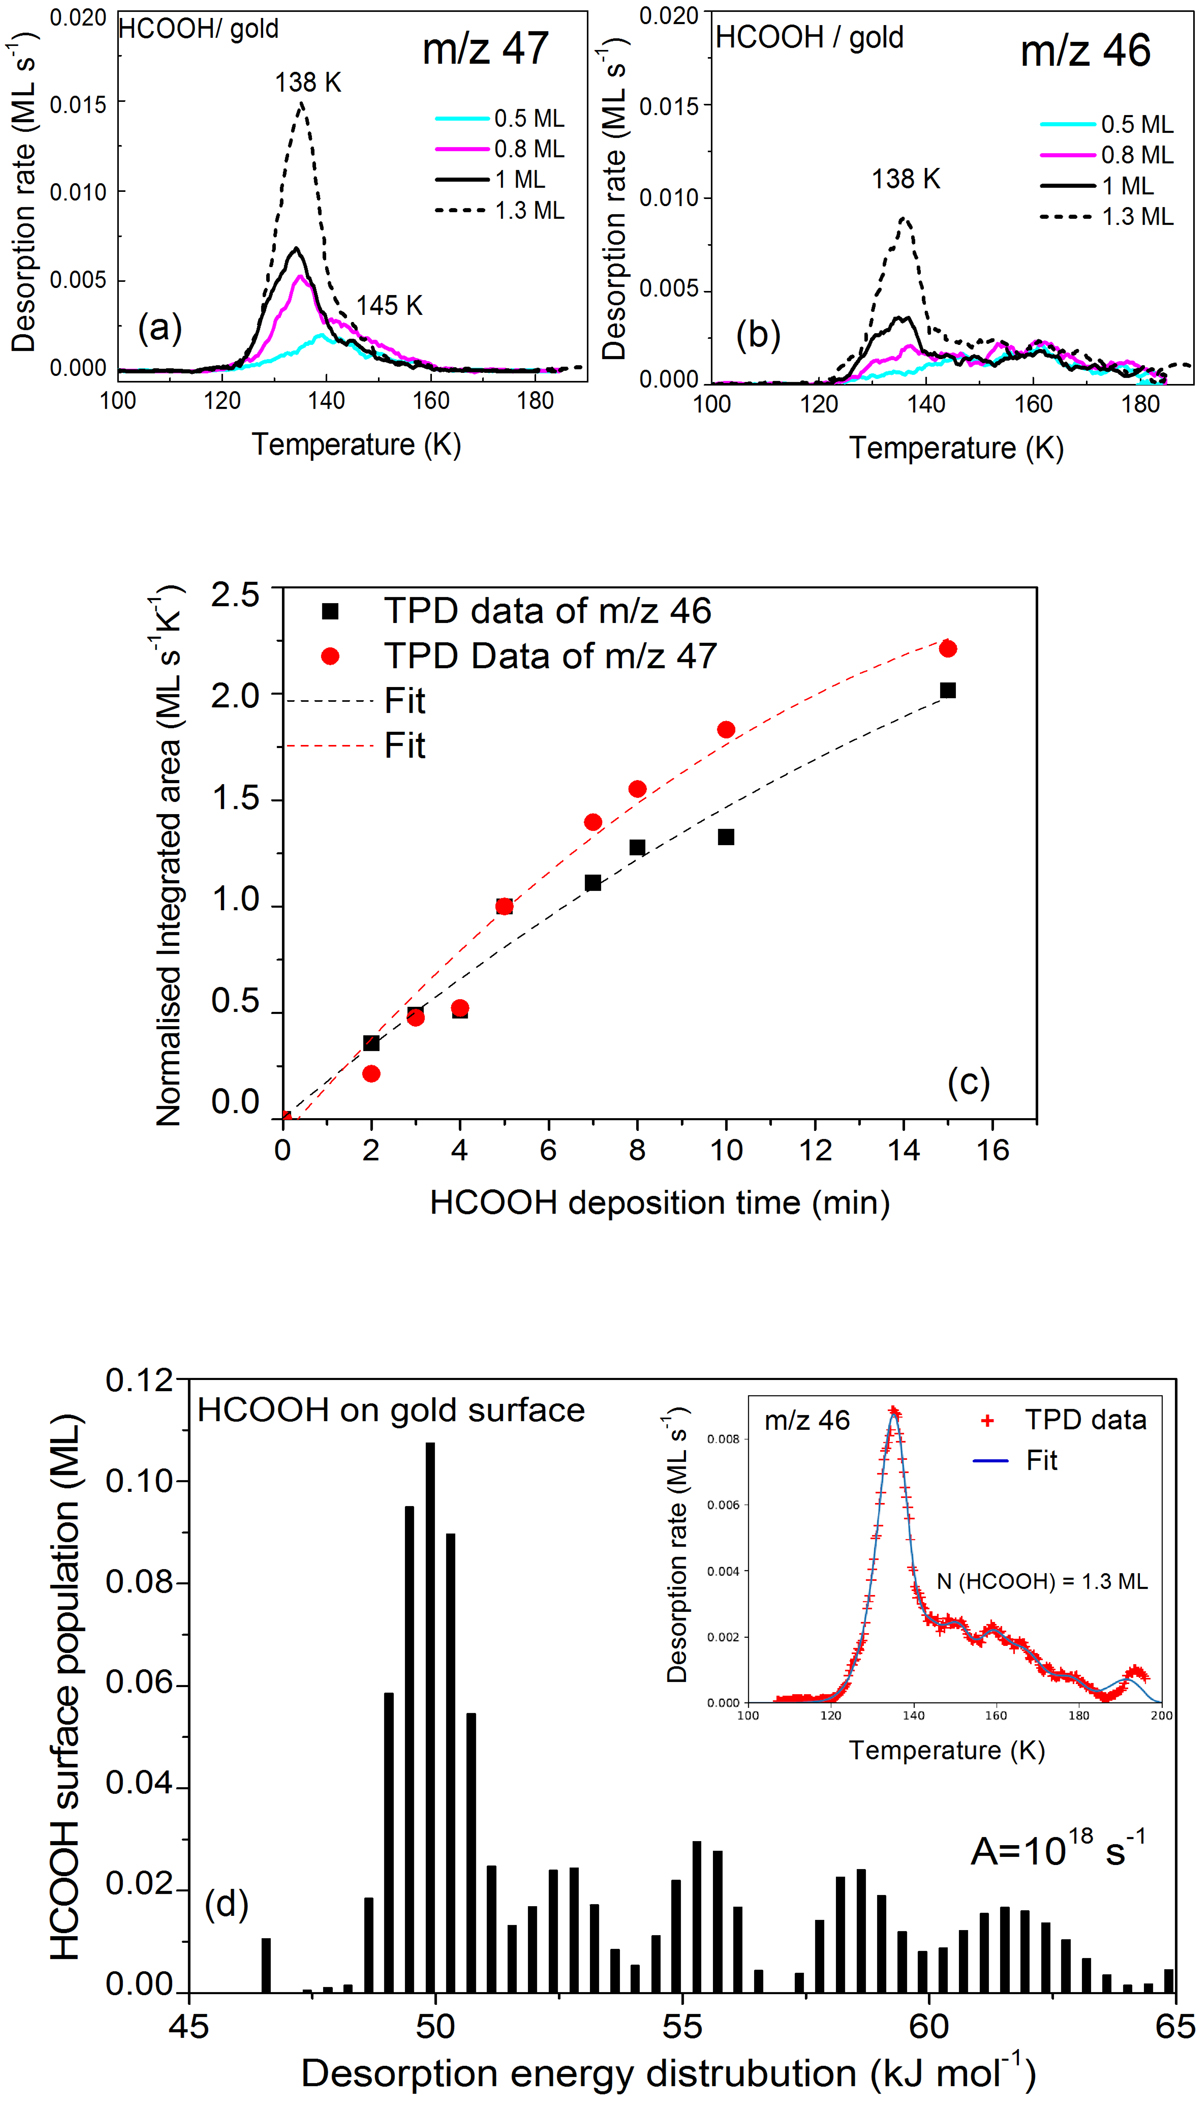
Thermal desorption results of HCOOH from gold surface. Panels a and b: desorption rates of HCOOH for m/z 47 and m/z 46 on gold surface; panel c: integrated areas below the TPD curves of HCOOH for m/z 47 and m/z 46 as a function of the HCOOH exposure time on gold surface; and panel d: surface population of HCOOH as a function of the desorption energy of HCOOH from gold surface for m/z 46. The desorption energy distribution Ei (in kJ mol−1) and the surface population Ni (in ML) are derived from the desorption rate Eq. (4) with the best-fit pre-exponential factor A = 1 × 10¹⁸ s−1. Figure in the inset shows the best fit of the TPD data (m/z 46) of HCOOH on gold surface for an exposure dose ![]() .
.
Current usage metrics show cumulative count of Article Views (full-text article views including HTML views, PDF and ePub downloads, according to the available data) and Abstracts Views on Vision4Press platform.
Data correspond to usage on the plateform after 2015. The current usage metrics is available 48-96 hours after online publication and is updated daily on week days.
Initial download of the metrics may take a while.