Fig. 3
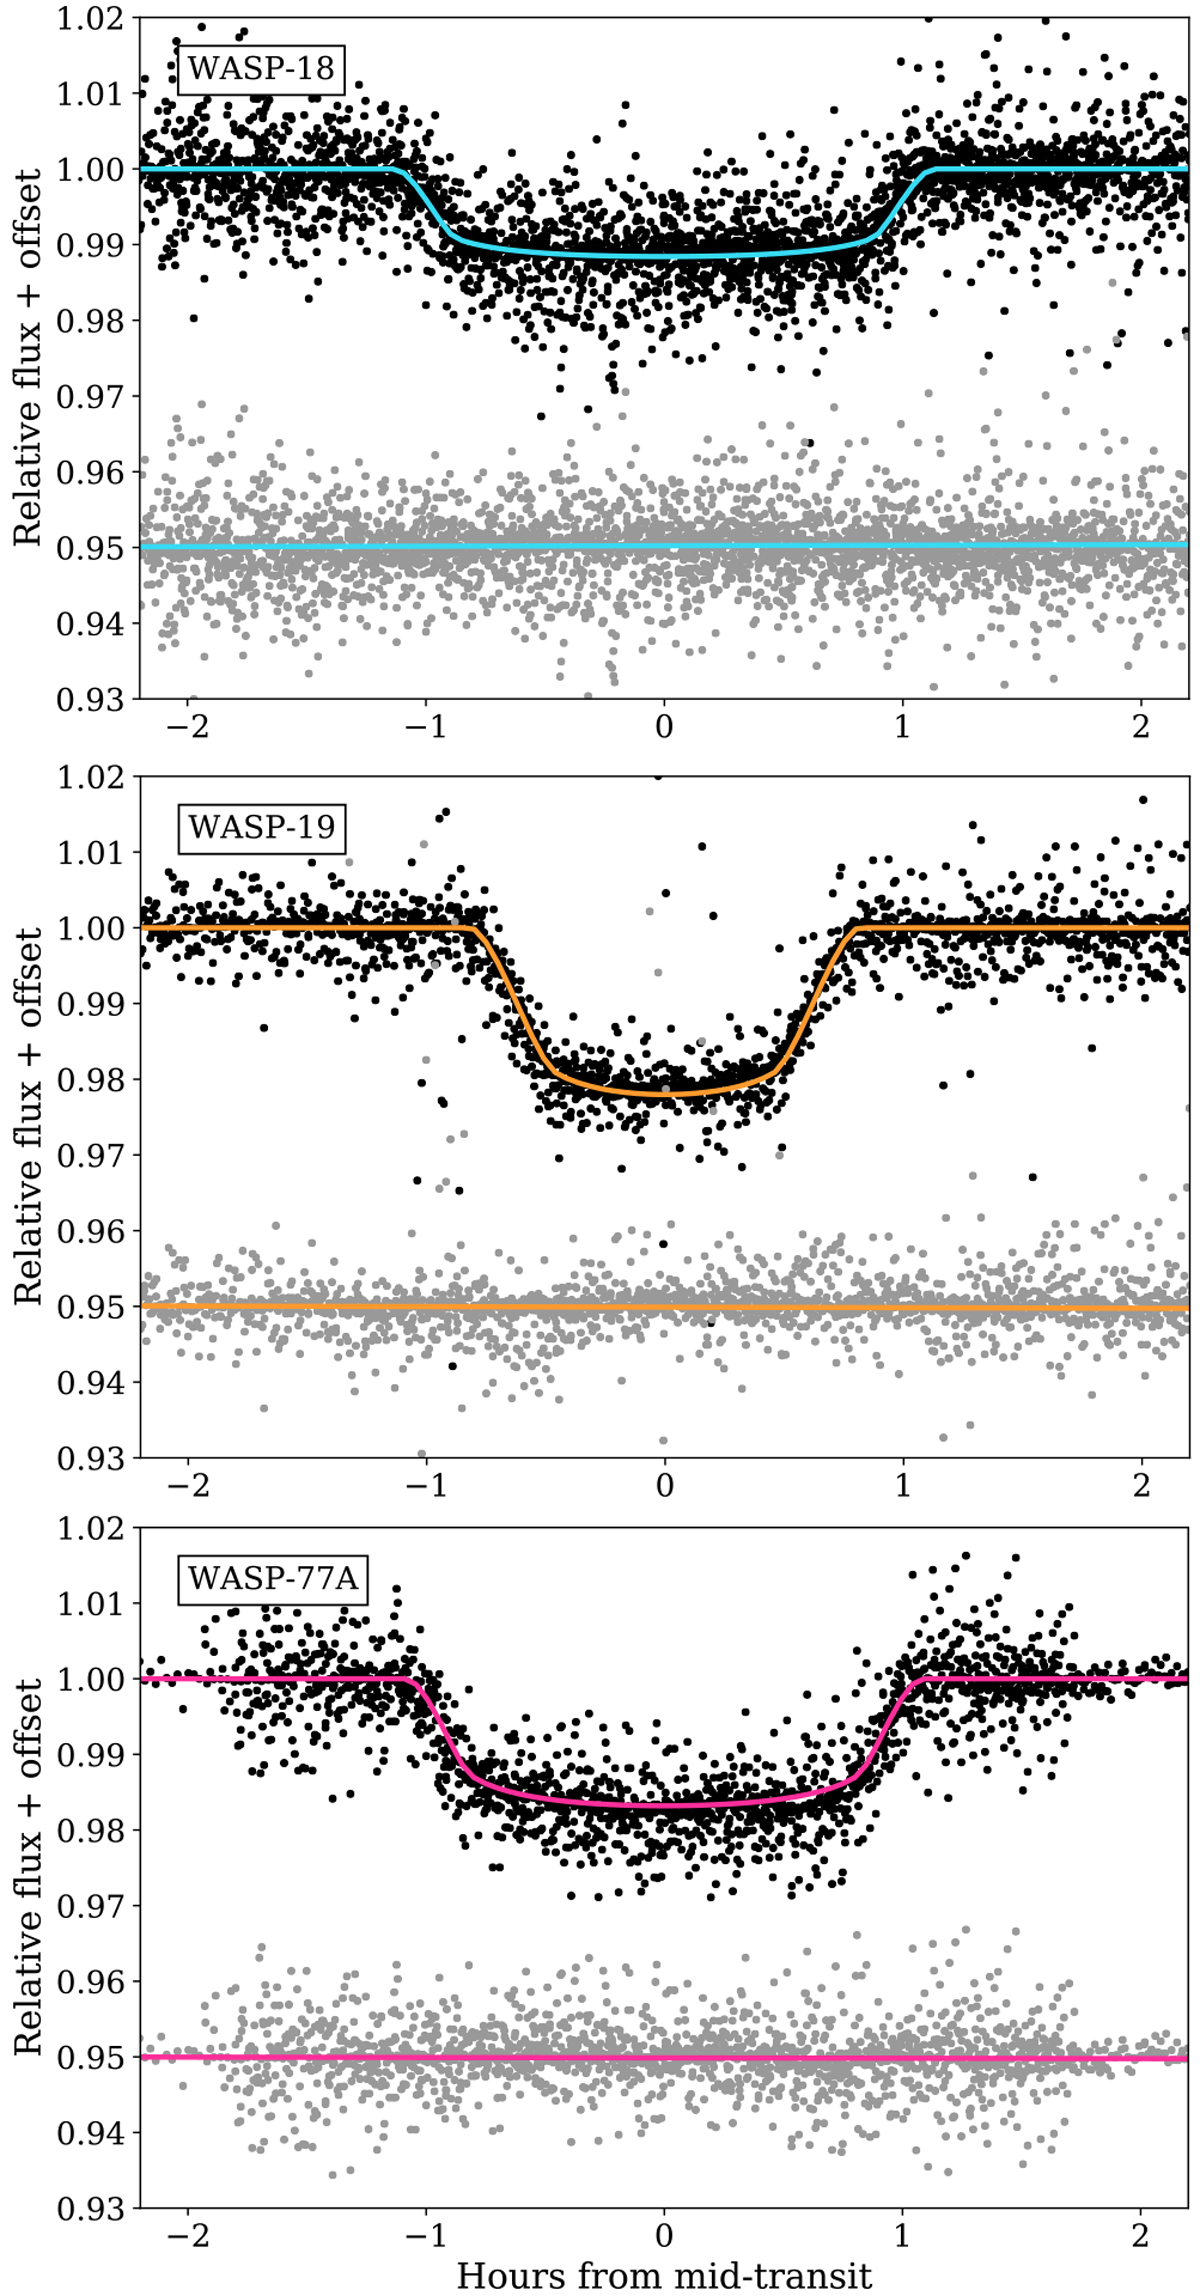
Phased light curves of WASP-18Ab, WASP-19b, and WASP-77Ab transits. The three data set of light curves are fitted simultaneously with RV archival data using EXOFASTv2 in order to estimate the orbital and physical parameters of the system. Top panel: the light blue solid line shows the best-fit model for WASP-18Ab, and below are the residuals in gray. Thesame is shown for WASP-19b in orange (center panel), and for WASP-77Ab in pink (bottom panel).
Current usage metrics show cumulative count of Article Views (full-text article views including HTML views, PDF and ePub downloads, according to the available data) and Abstracts Views on Vision4Press platform.
Data correspond to usage on the plateform after 2015. The current usage metrics is available 48-96 hours after online publication and is updated daily on week days.
Initial download of the metrics may take a while.