Fig. 2
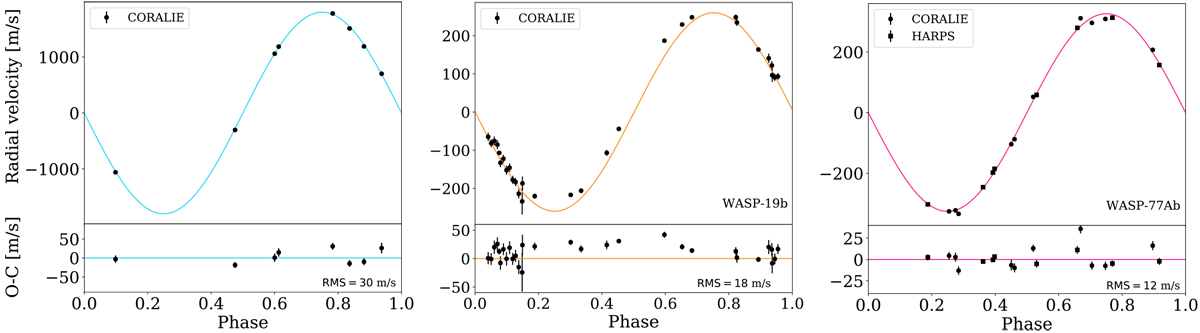
Radial-velocity observations of WASP-18A, WASP-19, and WASP-77A from Hellier et al. (2009), Hebb et al. (2010), and Maxted et al. (2013a), respectively. The best-fit model from the joint modeling of RV and light curves with EXOFASTv2 is shown as a solid colored line: light blue for WASP-18Ab, orange for WASP-19b, and pink for WASP-77Ab. The residuals of the model are shown in the bottom panel of each figure.
Current usage metrics show cumulative count of Article Views (full-text article views including HTML views, PDF and ePub downloads, according to the available data) and Abstracts Views on Vision4Press platform.
Data correspond to usage on the plateform after 2015. The current usage metrics is available 48-96 hours after online publication and is updated daily on week days.
Initial download of the metrics may take a while.