Fig. 9.
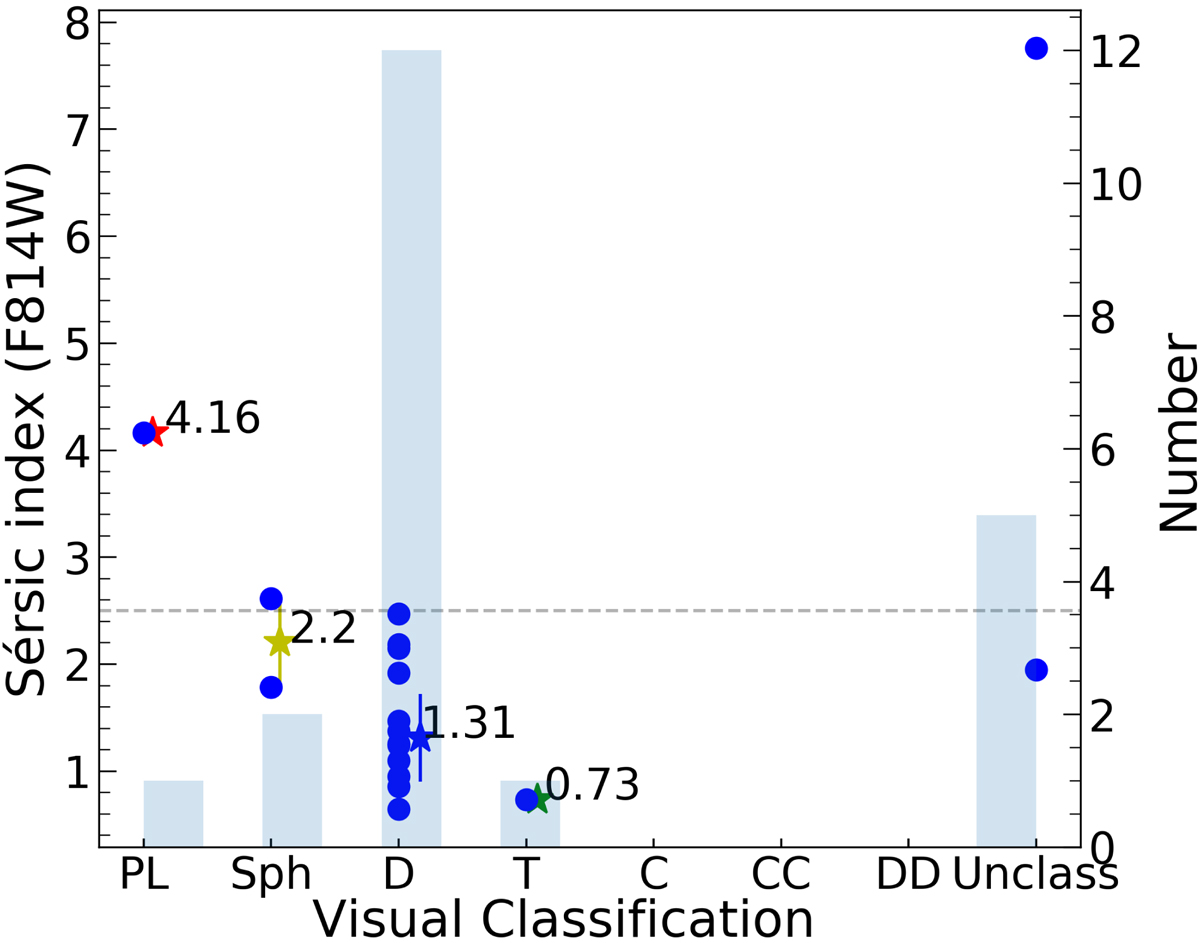
Comparison of the visual (x-axis) and automatic (y-axis) morphological classification or our Hα sample. Stars represent the mean value of the Sérsic index ![]() per visual type with error bars calculated as absolute standard deviation. The background histogram shows the total number of sources in each visual type. A total of five sources are visually unclassified, even though two of them have a Sérsic model from GALFIT.
per visual type with error bars calculated as absolute standard deviation. The background histogram shows the total number of sources in each visual type. A total of five sources are visually unclassified, even though two of them have a Sérsic model from GALFIT.
Current usage metrics show cumulative count of Article Views (full-text article views including HTML views, PDF and ePub downloads, according to the available data) and Abstracts Views on Vision4Press platform.
Data correspond to usage on the plateform after 2015. The current usage metrics is available 48-96 hours after online publication and is updated daily on week days.
Initial download of the metrics may take a while.