Fig. 8.
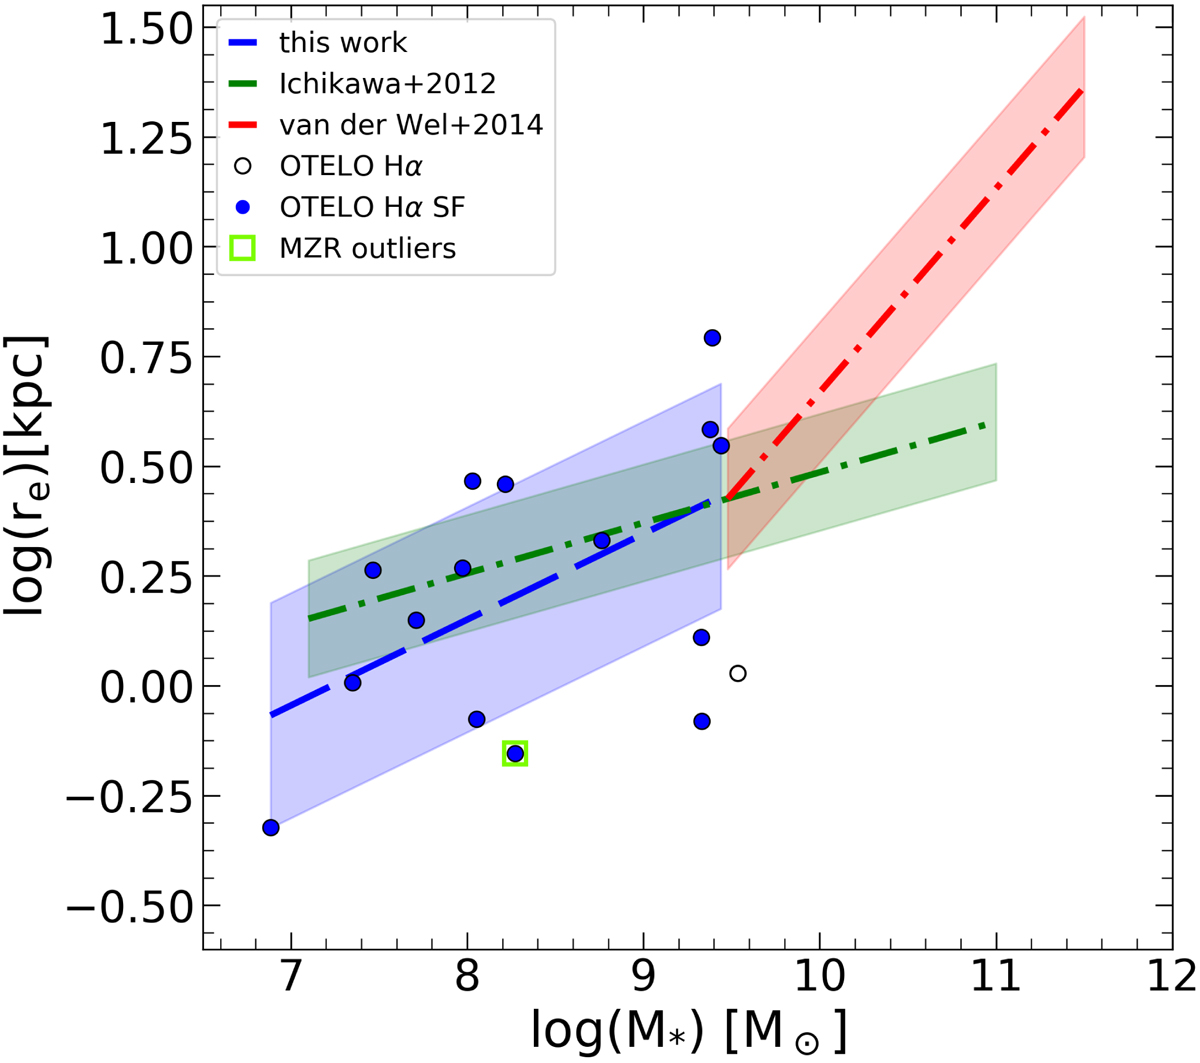
Physical half-light radius re as a function of the stellar mass M*. Black empty circles show the Hα sample, and blue markers show SF galaxies (in both cases we show sources for which it was possible to measure both variables). The green square shows the outlier of the MZR. The blue dashed line represents the linear fit in a form y = a + bx to the Hα sample with a = −1.41 ± 0.73 and b = 0.19 ± 0.09. The green dot-dashed line shows the linear fit from Ichikawa et al. (2012) with the logarithmic slope of 0.115. The red dot-dashed line shows the linear fit found by van der Wel et al. (2014) with a slope of 0.25. The green and red shaded regions represent the dispersion of the linear fit as estimated by Ichikawa et al. (2012) and van der Wel et al. (2014), respectively, while the blue shaded region shows the dispersion of our measurement estimated as the median absolute deviation of 0.2.
Current usage metrics show cumulative count of Article Views (full-text article views including HTML views, PDF and ePub downloads, according to the available data) and Abstracts Views on Vision4Press platform.
Data correspond to usage on the plateform after 2015. The current usage metrics is available 48-96 hours after online publication and is updated daily on week days.
Initial download of the metrics may take a while.