Fig. 7.
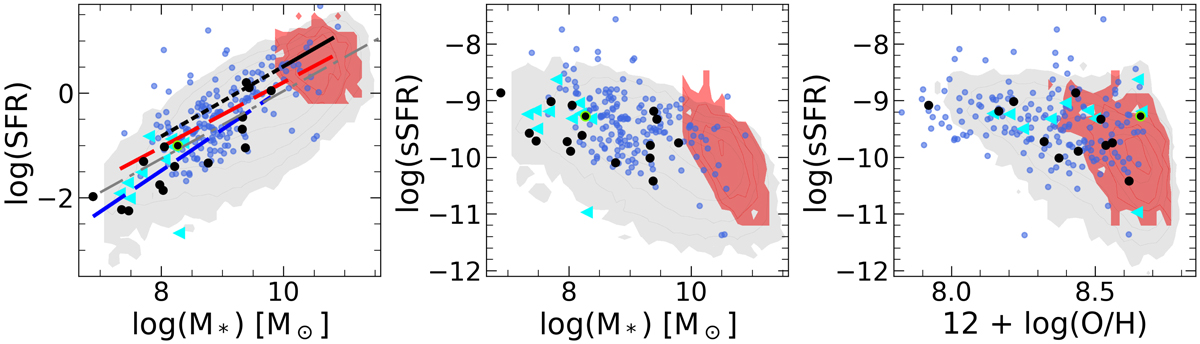
Star formation rate and sSFR as a funcion of stellar mass and metallicity. In all panels, black markers show the OTELO SFG sample, green empty circles show transitional dwarf galaxies, cyan triangles show VVDS-Ultra-Deep data, blue dots show VVDS-Deep data, and contours in red and grey show the GAMA and local SDSS samples, respectively. Left panel: linear fits to our SFG sample (blue dashed line), VVDS Deep+Ultra-Deep (both selected sub-samples from VVDS, red dashed-line), and the fit from Noeske et al. (2007; black solid line), which is given in the mass range of 1010 − 1011 M⊙, and the black dashed line is an extrapolation of their fit down to 108 M⊙. The grey dashed line shows the linear fit of the local SDSS sample. For clarity we do not plot the estimated dispersions for any fit.
Current usage metrics show cumulative count of Article Views (full-text article views including HTML views, PDF and ePub downloads, according to the available data) and Abstracts Views on Vision4Press platform.
Data correspond to usage on the plateform after 2015. The current usage metrics is available 48-96 hours after online publication and is updated daily on week days.
Initial download of the metrics may take a while.