Fig. 6.
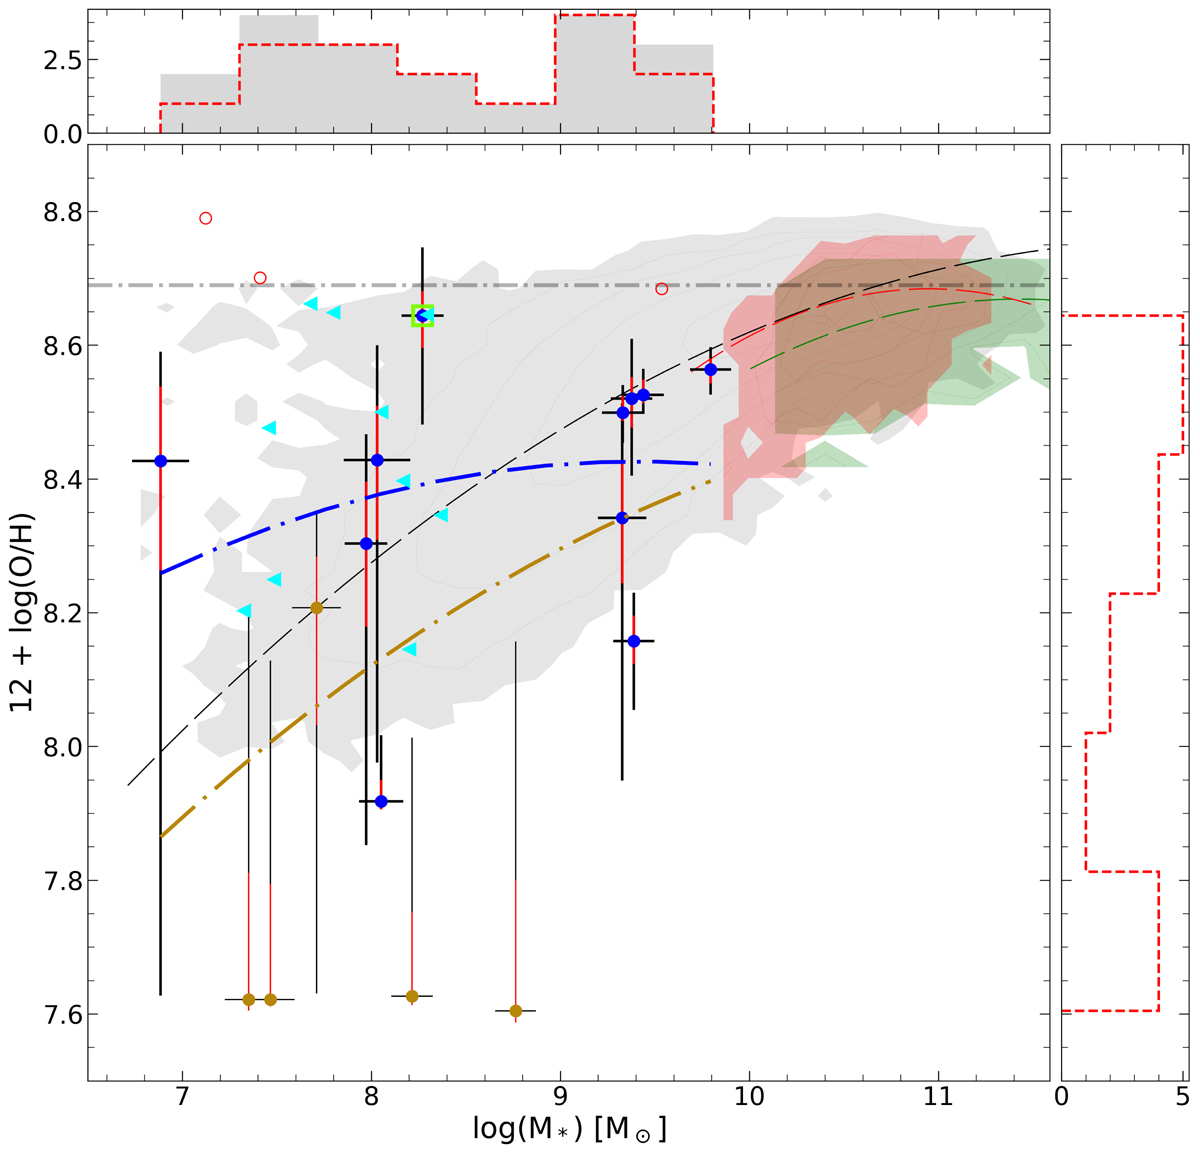
Mass-metallicity relation for OTELO Hα ELS. Blue and golden markers represent sources with an [N II]λ6583 line flux above and below OTELO flux limit, respectively. The light green empty square shows the MZR outlier as defined by Peeples et al. (2008). Cyan triangles show the VVDS-Ultra-Deep selected sample with zmean = 0.26. Grey filled contours show local SDSS SFGs. Green filled contours show the high-z SDSS sample. Red filled contours show the SFG sample from the GAMA survey. All fits shown in this figure represent second-order polynomial fits. The blue dot-dashed line is the OTELO MZR fit to the sources with an [N II] line flux above the OTELO line flux limit, and the golden dot-dashed line shows the OTELO MZR including low-flux sources; the black thin dashed line shows the fit to the local SDSS sample; and green and red dashed lines show the SDSS and GAMA samples at z ∼ 0.3, respectively. The error bars correspond to the 25% (red) and 68% (black) confidence interval around the most probable value. The calibration uncertainty in metallicity is not included.
Current usage metrics show cumulative count of Article Views (full-text article views including HTML views, PDF and ePub downloads, according to the available data) and Abstracts Views on Vision4Press platform.
Data correspond to usage on the plateform after 2015. The current usage metrics is available 48-96 hours after online publication and is updated daily on week days.
Initial download of the metrics may take a while.