Fig. 4.
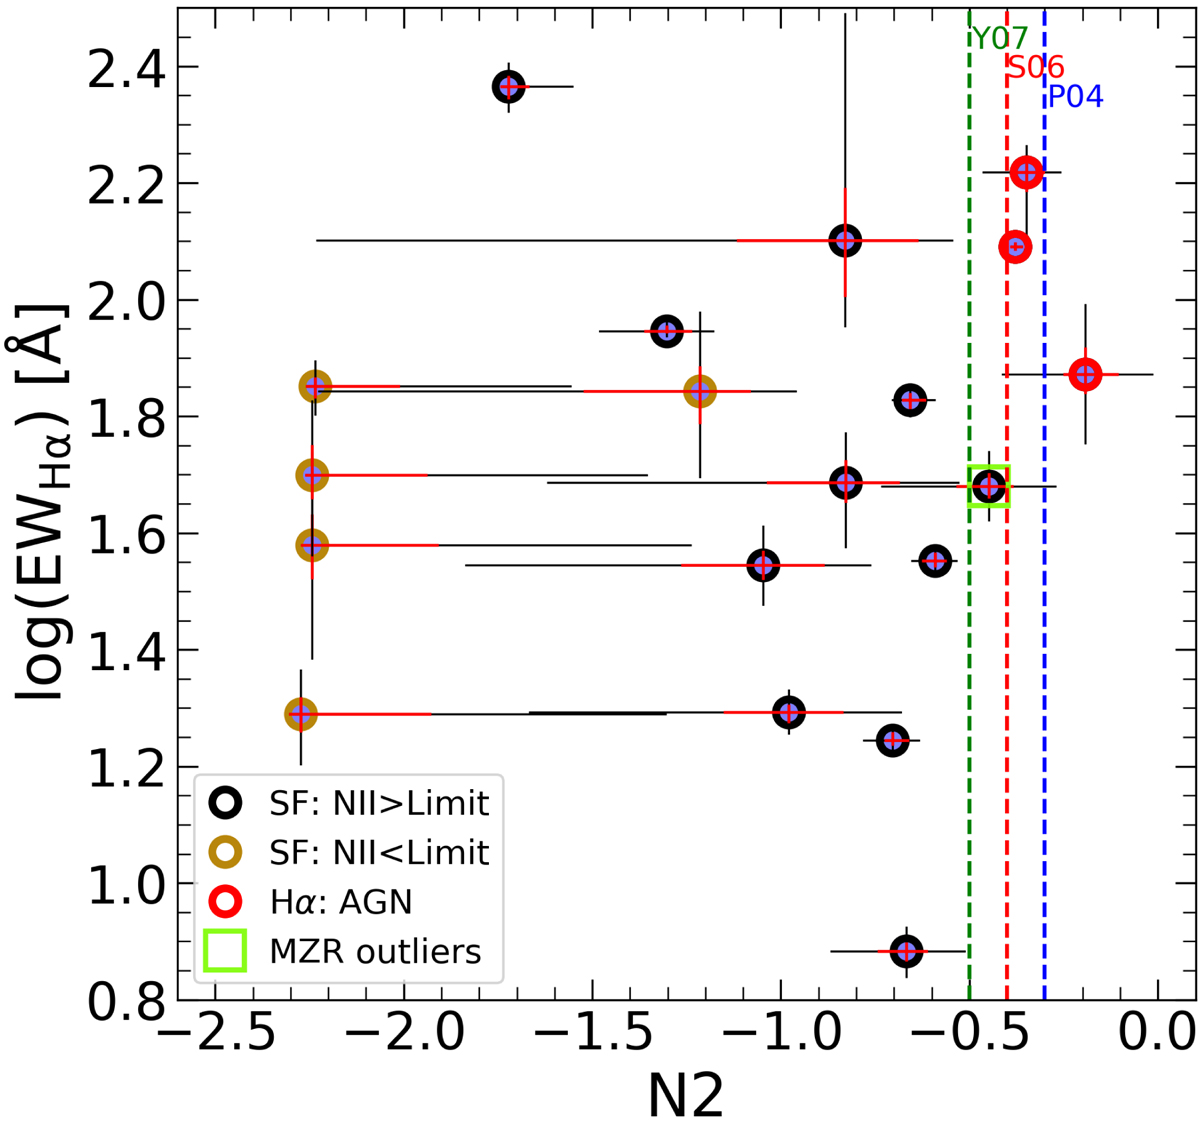
N2 index vs. EWHα. Blue points show all the Hα candidates. Black and golden circles represent sources with an [N II] line flux above and below OTELO flux limit, respectively (see Sect. 3.2 and Bongiovanni et al. 2020). Red circles show AGN candidates selected using the Stasińska et al. (2006) empirical limit of N2 = −0.4. Vertical green and blue dashed lines show the Yin et al. (2007) and Pettini & Pagel (2004) limits of their calibration using the N2 index, respectively. The red line shows the AGN selection limit from Stasińska et al. (2006). The error bars in each object correspond to the 25% and 68% confidence interval around the most probable value.
Current usage metrics show cumulative count of Article Views (full-text article views including HTML views, PDF and ePub downloads, according to the available data) and Abstracts Views on Vision4Press platform.
Data correspond to usage on the plateform after 2015. The current usage metrics is available 48-96 hours after online publication and is updated daily on week days.
Initial download of the metrics may take a while.