Fig. A.1.
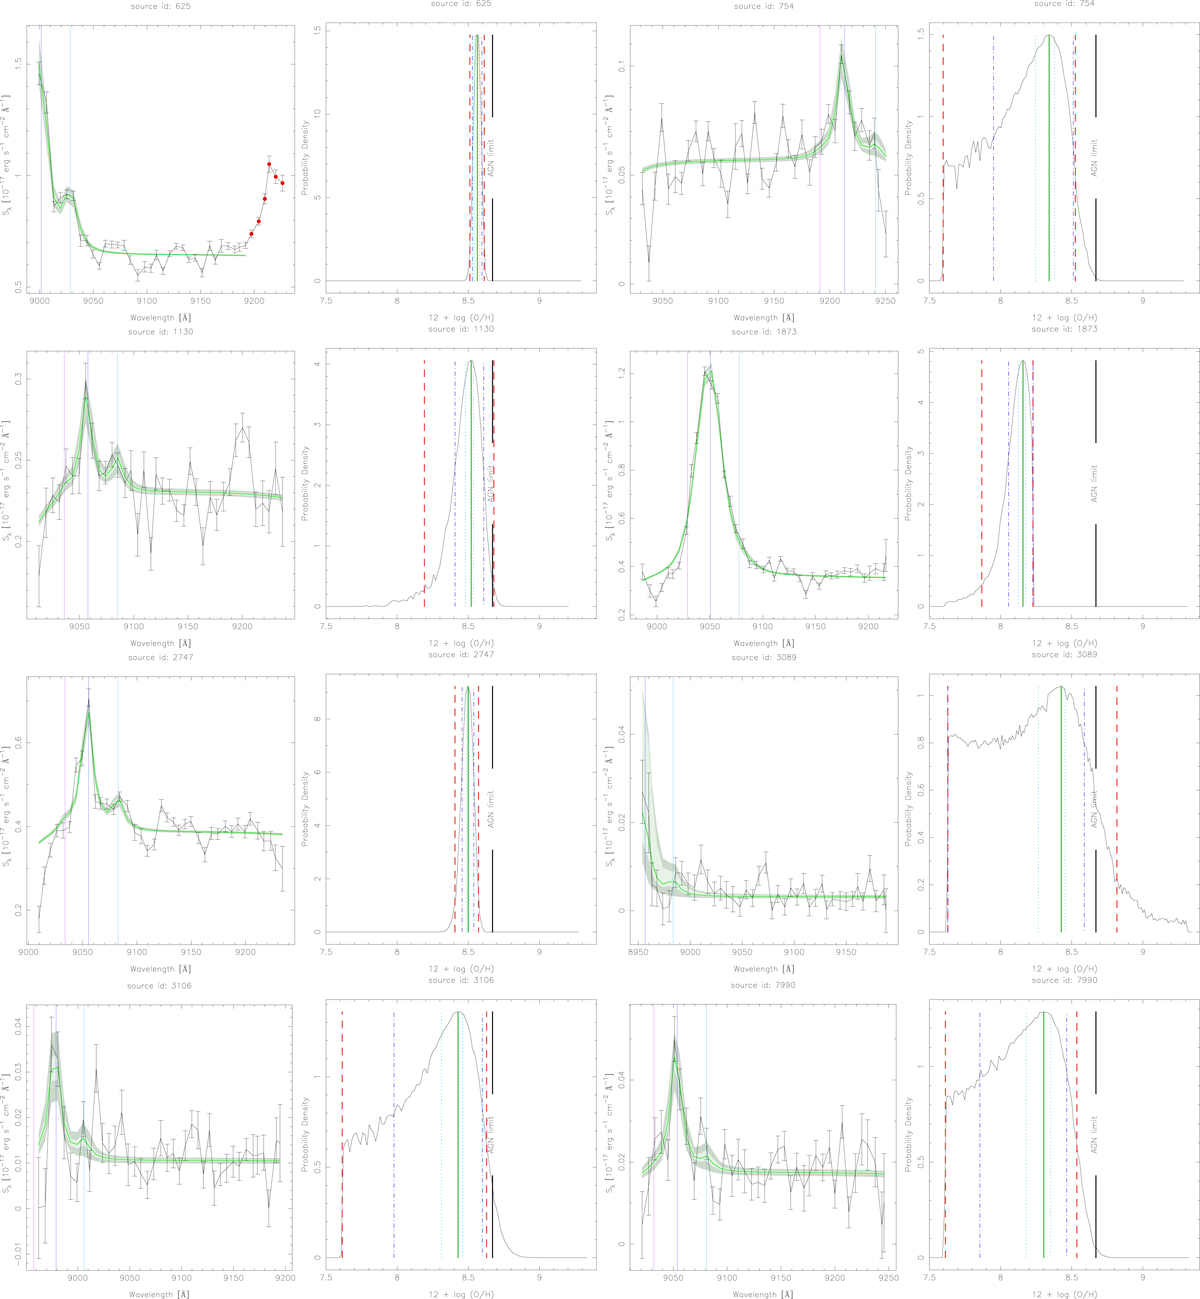
Observed PS, the best-fit PS, and the envelope of the PS simulations where all parameters are in the 25% confidence interval (light green) and 68% confidence interval (light grey) for the first eight SFG for which an Hα + [N II] line is detected. Violet, blue, and cyan vertical lines in the PS figures show the position of the [N II]λ6548, Hα, and [N II]λ6583 line, respectively, for the best z obtained in by the fit. The red points that appear in some observed PS were removed during the fitting process because they correspond to the [S II]λλ6716,6731 doublet or may be artefacts. To the right of each PS is the PDF of 12 + log(O/H) that was obtained from the Monte Carlo simulations where the mode (our reference value), the 25%, 68%, and 90% confidence intervals around the mode are shown as vertical lines; the black vertical line in these plots shows the empirical division between SFR and AGN at 12 + log(O/H) = 8.67 (N2 = −0.4).
Current usage metrics show cumulative count of Article Views (full-text article views including HTML views, PDF and ePub downloads, according to the available data) and Abstracts Views on Vision4Press platform.
Data correspond to usage on the plateform after 2015. The current usage metrics is available 48-96 hours after online publication and is updated daily on week days.
Initial download of the metrics may take a while.