Fig. 1.
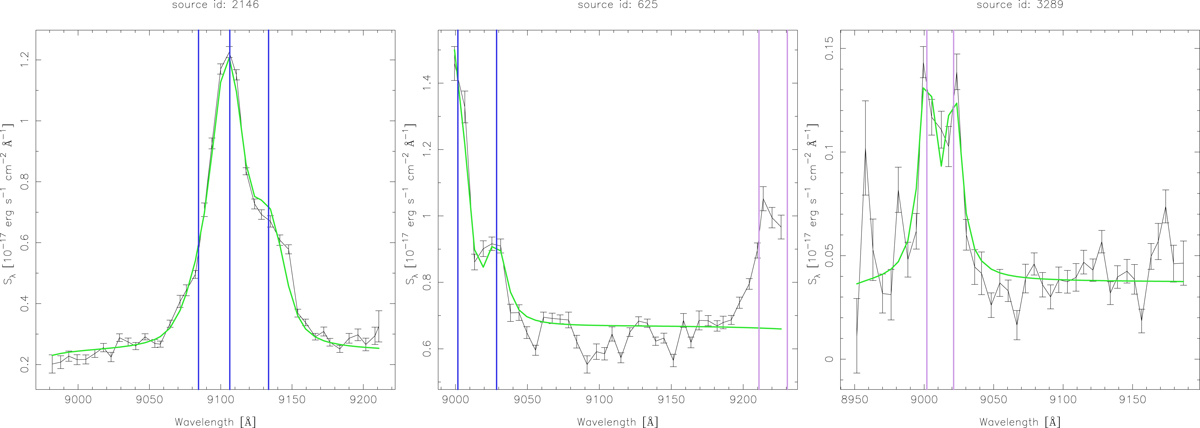
Pseudo-spectra of selected sources. From left: source id: 2146 with a clear Hα + [N II] emission line complex at z = 0.387; source id: 625 with Hα (truncated in the blue side) and [N II] emission lines and [S II]λ6716 (on the red side of the spectrum) at z = 0.371; and source id: 3289, which exhibits the [S II]λλ6716,6731 doublet at z = 0.340. The green line shows the best-fit synthetic spectrum after the convolution process. See Sect. 3.2 for details.
Current usage metrics show cumulative count of Article Views (full-text article views including HTML views, PDF and ePub downloads, according to the available data) and Abstracts Views on Vision4Press platform.
Data correspond to usage on the plateform after 2015. The current usage metrics is available 48-96 hours after online publication and is updated daily on week days.
Initial download of the metrics may take a while.