Open Access
Fig. 12.
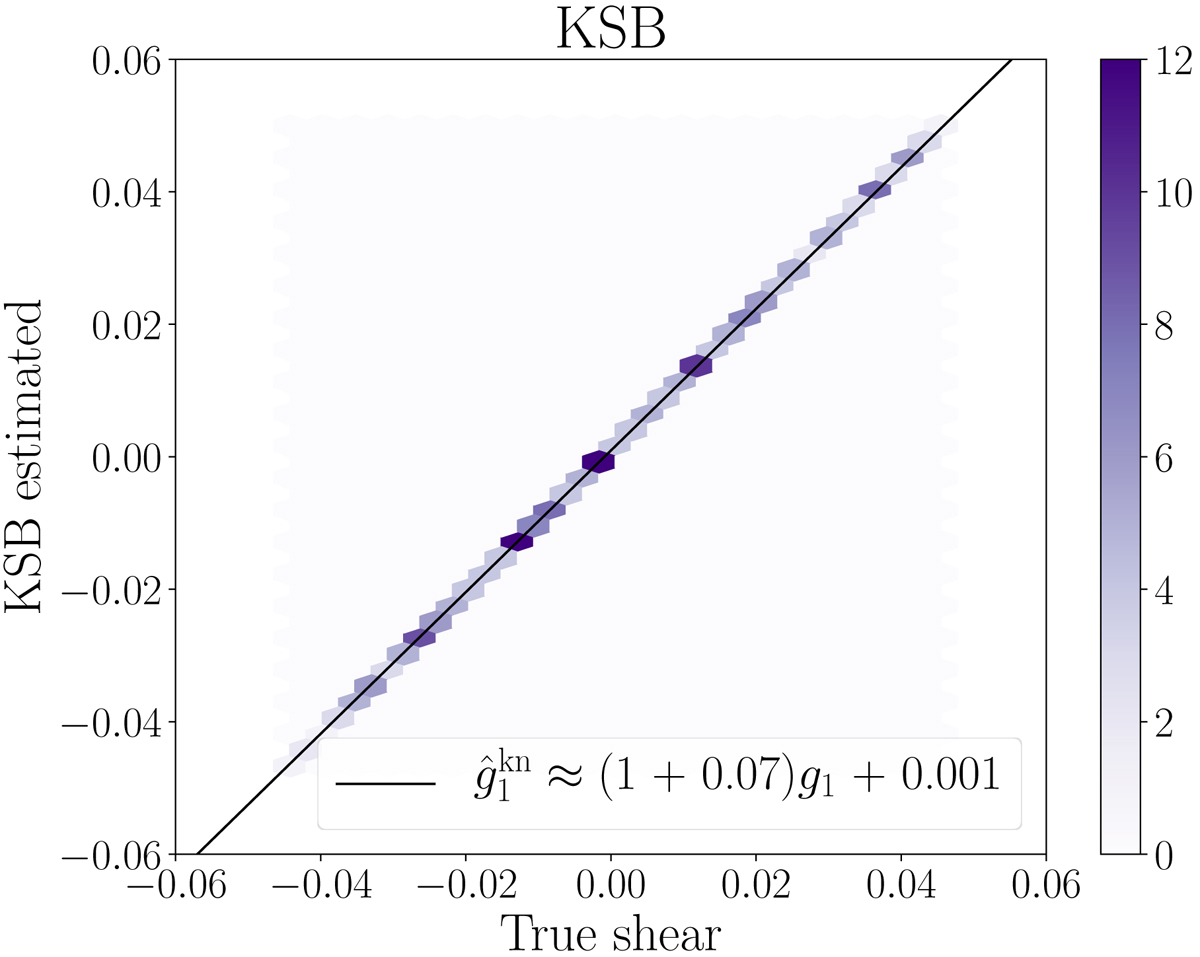
2D density of true and measured shear; the colors correspond to the number of occurrences of measured shear values when using the known PSF, each from approximatively 10 000 galaxies, for the corresponding input shear. The line shows the best-fit linear regression, yielding the bias values. Shapes were measured with KSB.
Current usage metrics show cumulative count of Article Views (full-text article views including HTML views, PDF and ePub downloads, according to the available data) and Abstracts Views on Vision4Press platform.
Data correspond to usage on the plateform after 2015. The current usage metrics is available 48-96 hours after online publication and is updated daily on week days.
Initial download of the metrics may take a while.