Fig. 6.
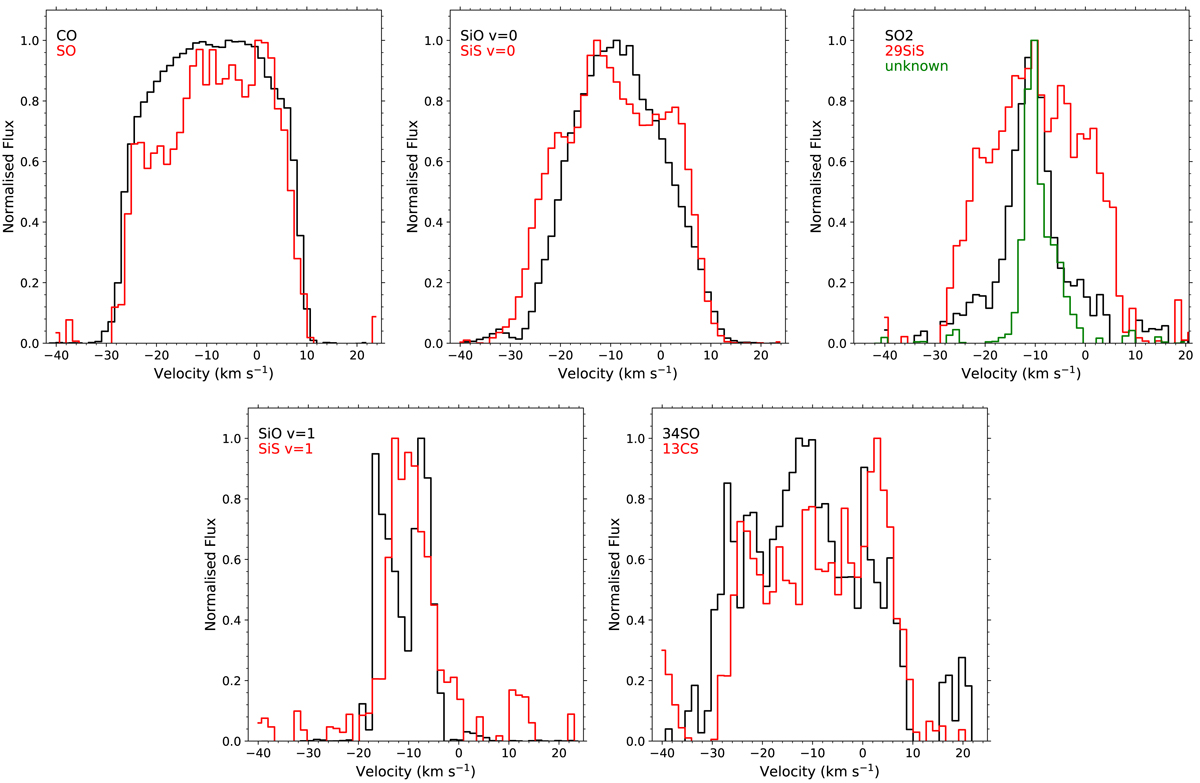
Normalised spectra for all detected lines, separated in groups for better visualisation. The transitions are labelled with the corresponding colours. For the CO and SO lines, a circular region of 6″ in radius was used, encompassing the vast majority of the spatially extended emission. For the other more spatially compact molecules a box of 1.5 × 1.5″ was used.
Current usage metrics show cumulative count of Article Views (full-text article views including HTML views, PDF and ePub downloads, according to the available data) and Abstracts Views on Vision4Press platform.
Data correspond to usage on the plateform after 2015. The current usage metrics is available 48-96 hours after online publication and is updated daily on week days.
Initial download of the metrics may take a while.