Fig. 5.
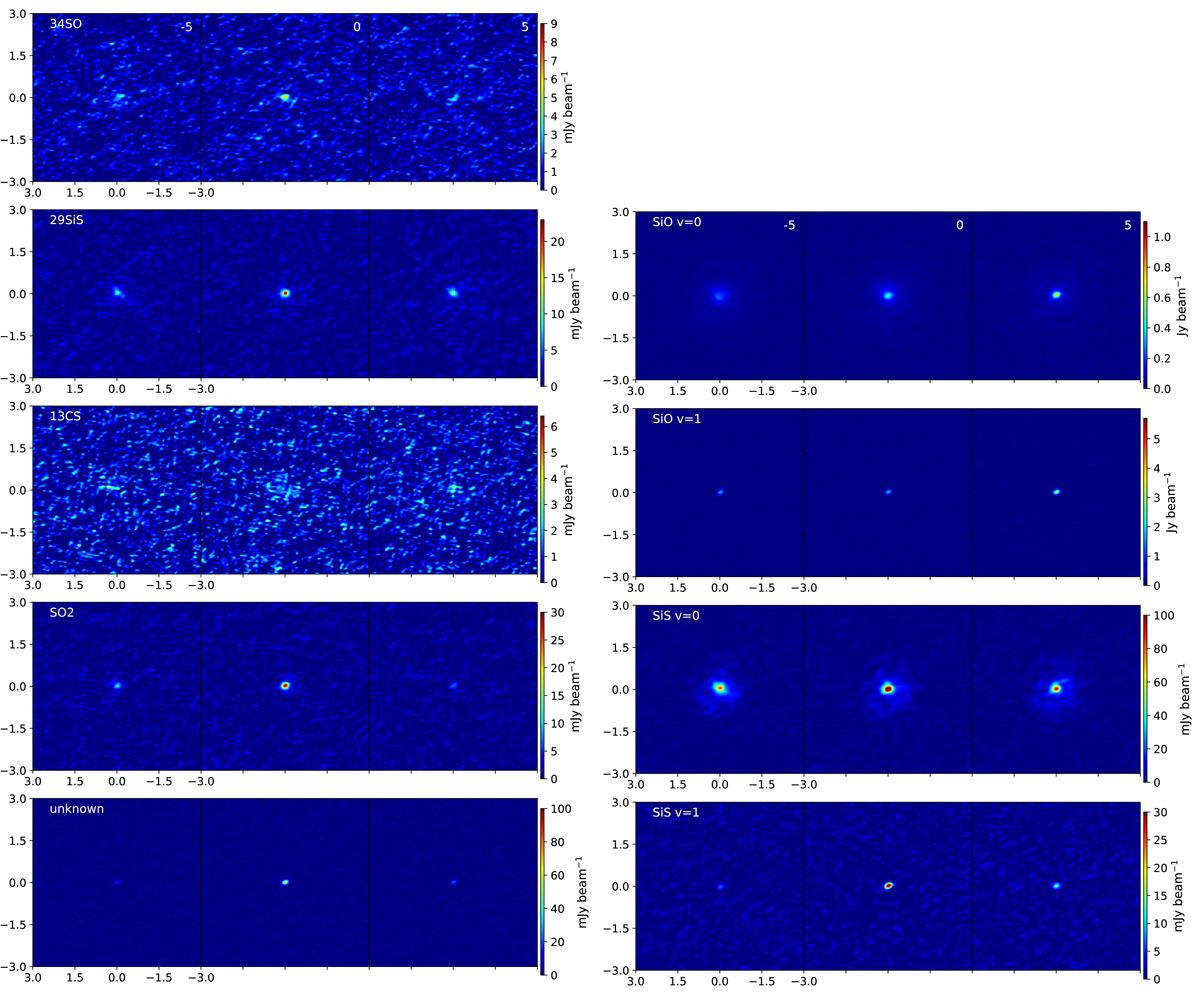
Sample 1.3 km s−1 channel maps for the rest of the molecular lines detected towards GX Mon. Given the often narrower line widths compared to CO and SO, we show the velocity channels at −5, 0 and +5 km s−1 compared to the systemic velocity of −9 km s−1. See Table 1 for the full names of the transitions and the rest frequencies used.
Current usage metrics show cumulative count of Article Views (full-text article views including HTML views, PDF and ePub downloads, according to the available data) and Abstracts Views on Vision4Press platform.
Data correspond to usage on the plateform after 2015. The current usage metrics is available 48-96 hours after online publication and is updated daily on week days.
Initial download of the metrics may take a while.