Fig. 2.
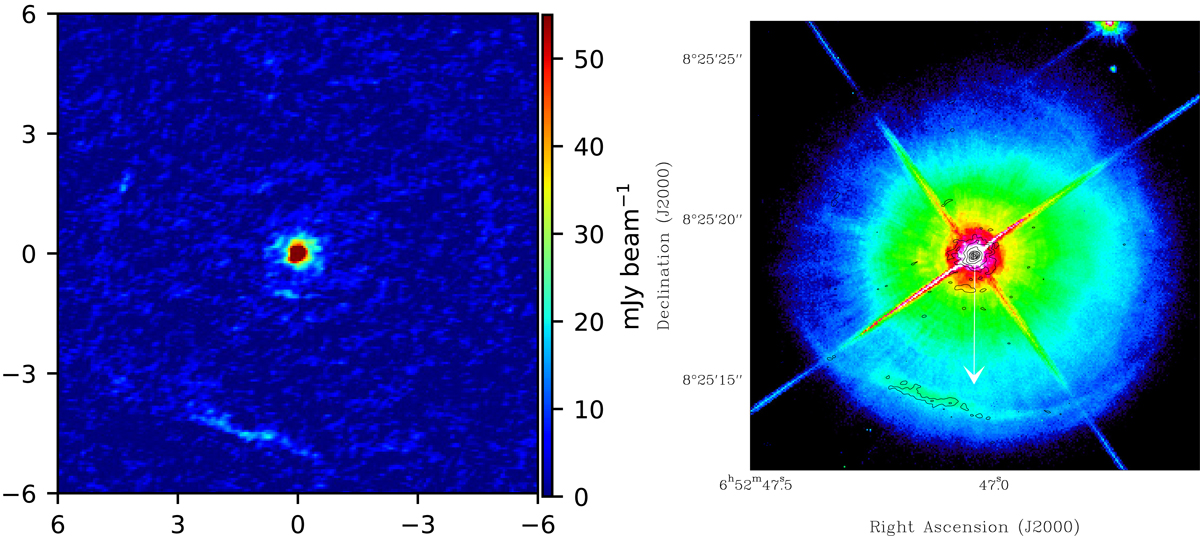
Left: SO (5−4) line emission obtained by binning the velocity channels between −11.4 and −4.9 km s−1, chosen so as to emphasise the morphology of the weak ring and arc-like emission. Right: composite ACS/HST image of GX Mon in the F606W and F814W bands, overlaid with the SO (5–4) emission from the left panel (black contours). The white arrow indicates the direction of the proper motion as taken from Gaia DR2 via Simbad.
Current usage metrics show cumulative count of Article Views (full-text article views including HTML views, PDF and ePub downloads, according to the available data) and Abstracts Views on Vision4Press platform.
Data correspond to usage on the plateform after 2015. The current usage metrics is available 48-96 hours after online publication and is updated daily on week days.
Initial download of the metrics may take a while.