Fig. 1.
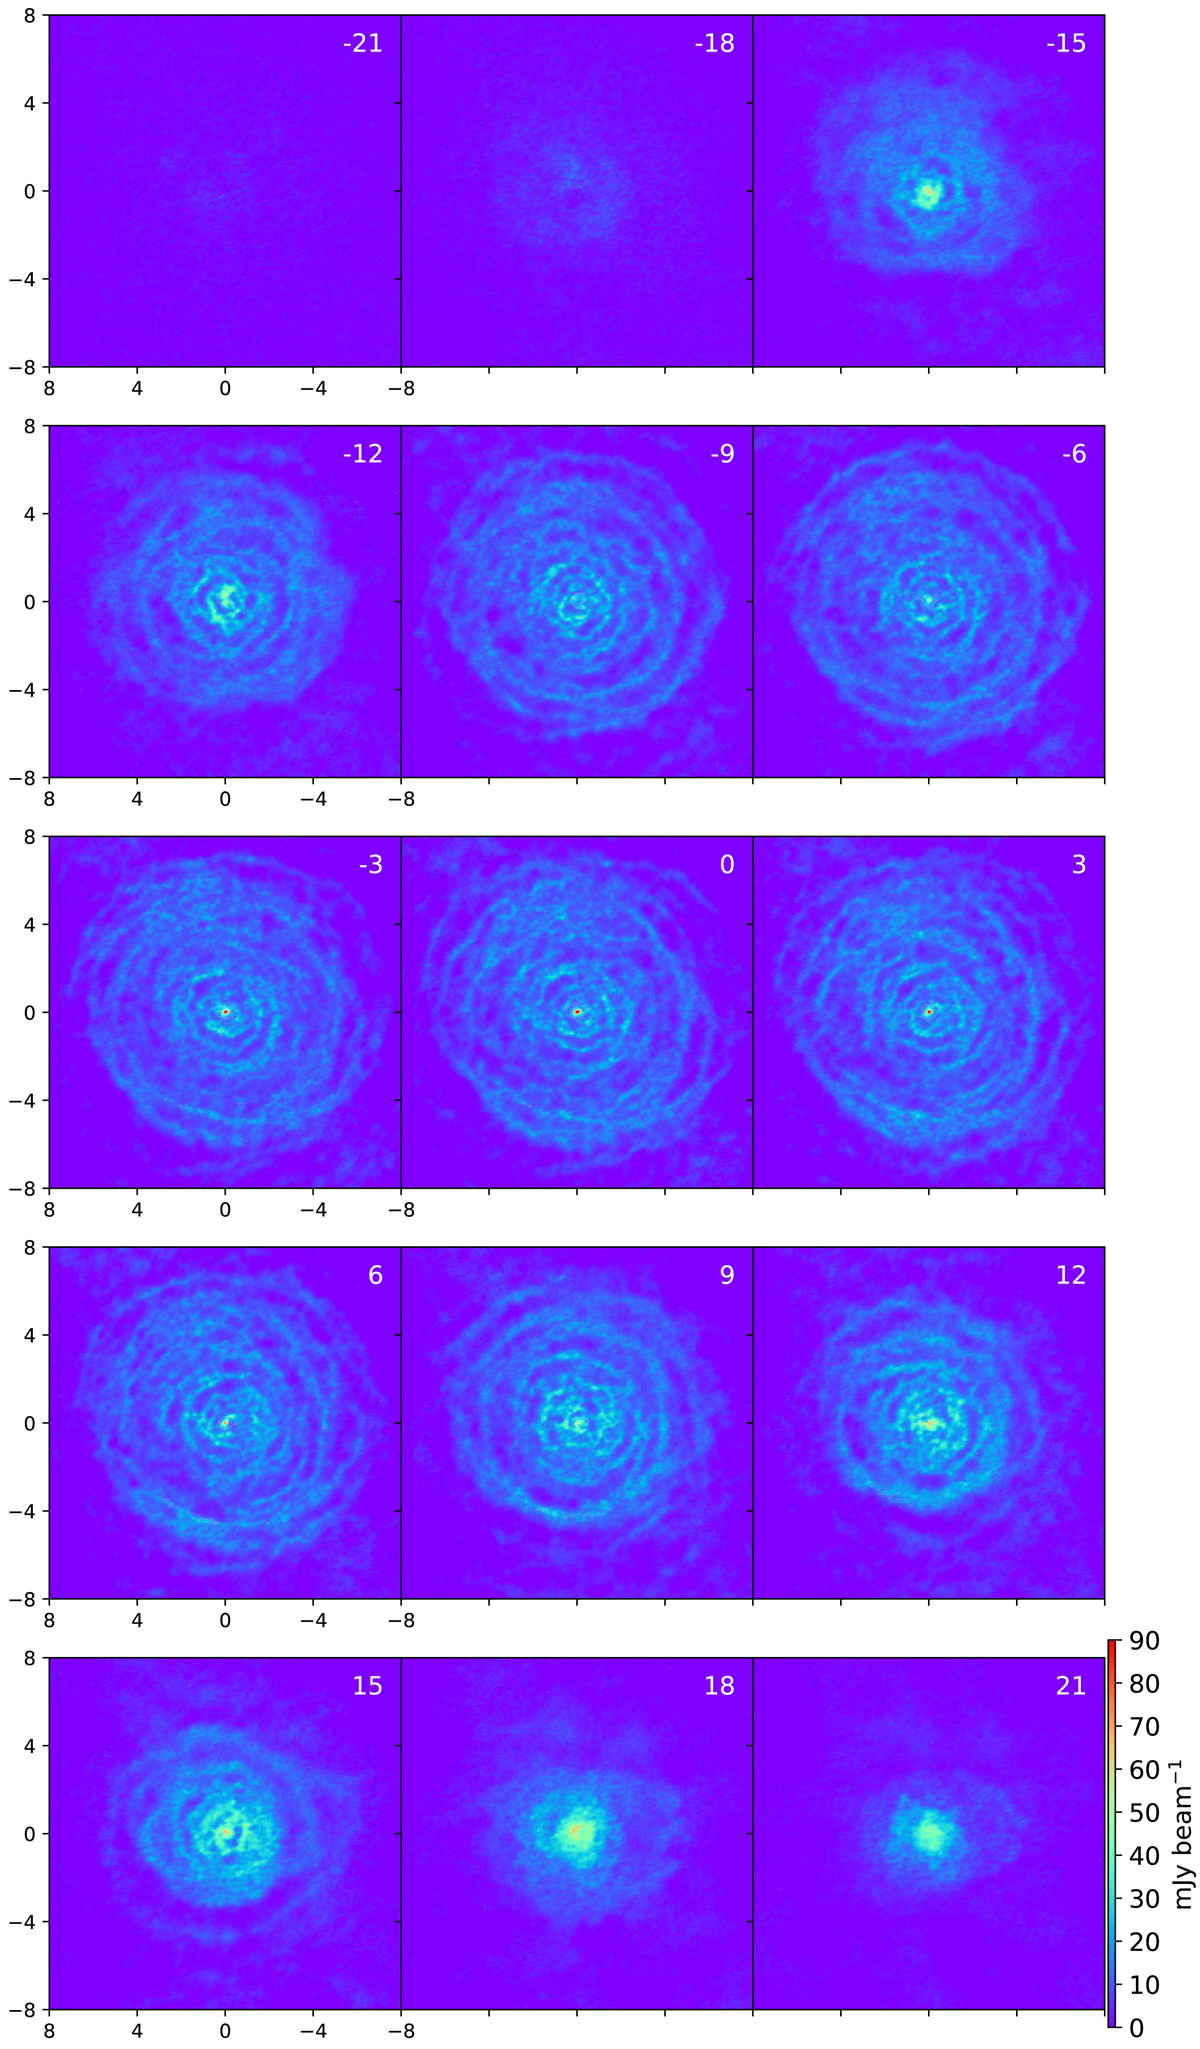
Channel maps for the 12CO (2–1) emission. Images are shown for 1.3 km s−1 channel bins, spaced 3 km s−1 apart and shifted to zero at the systemic velocity of −9 km s−1. The overlaid white contours correspond to the SO emission, and trace 4, 5, 6, 10, and 14 times the rms value of 0.93 mJy beam−1. In this and all other spatial figures, the x and y axes give the relative RA and Dec in arcseconds from the position of GX Mon, unless otherwise indicated.
Current usage metrics show cumulative count of Article Views (full-text article views including HTML views, PDF and ePub downloads, according to the available data) and Abstracts Views on Vision4Press platform.
Data correspond to usage on the plateform after 2015. The current usage metrics is available 48-96 hours after online publication and is updated daily on week days.
Initial download of the metrics may take a while.