Free Access
Fig. 1
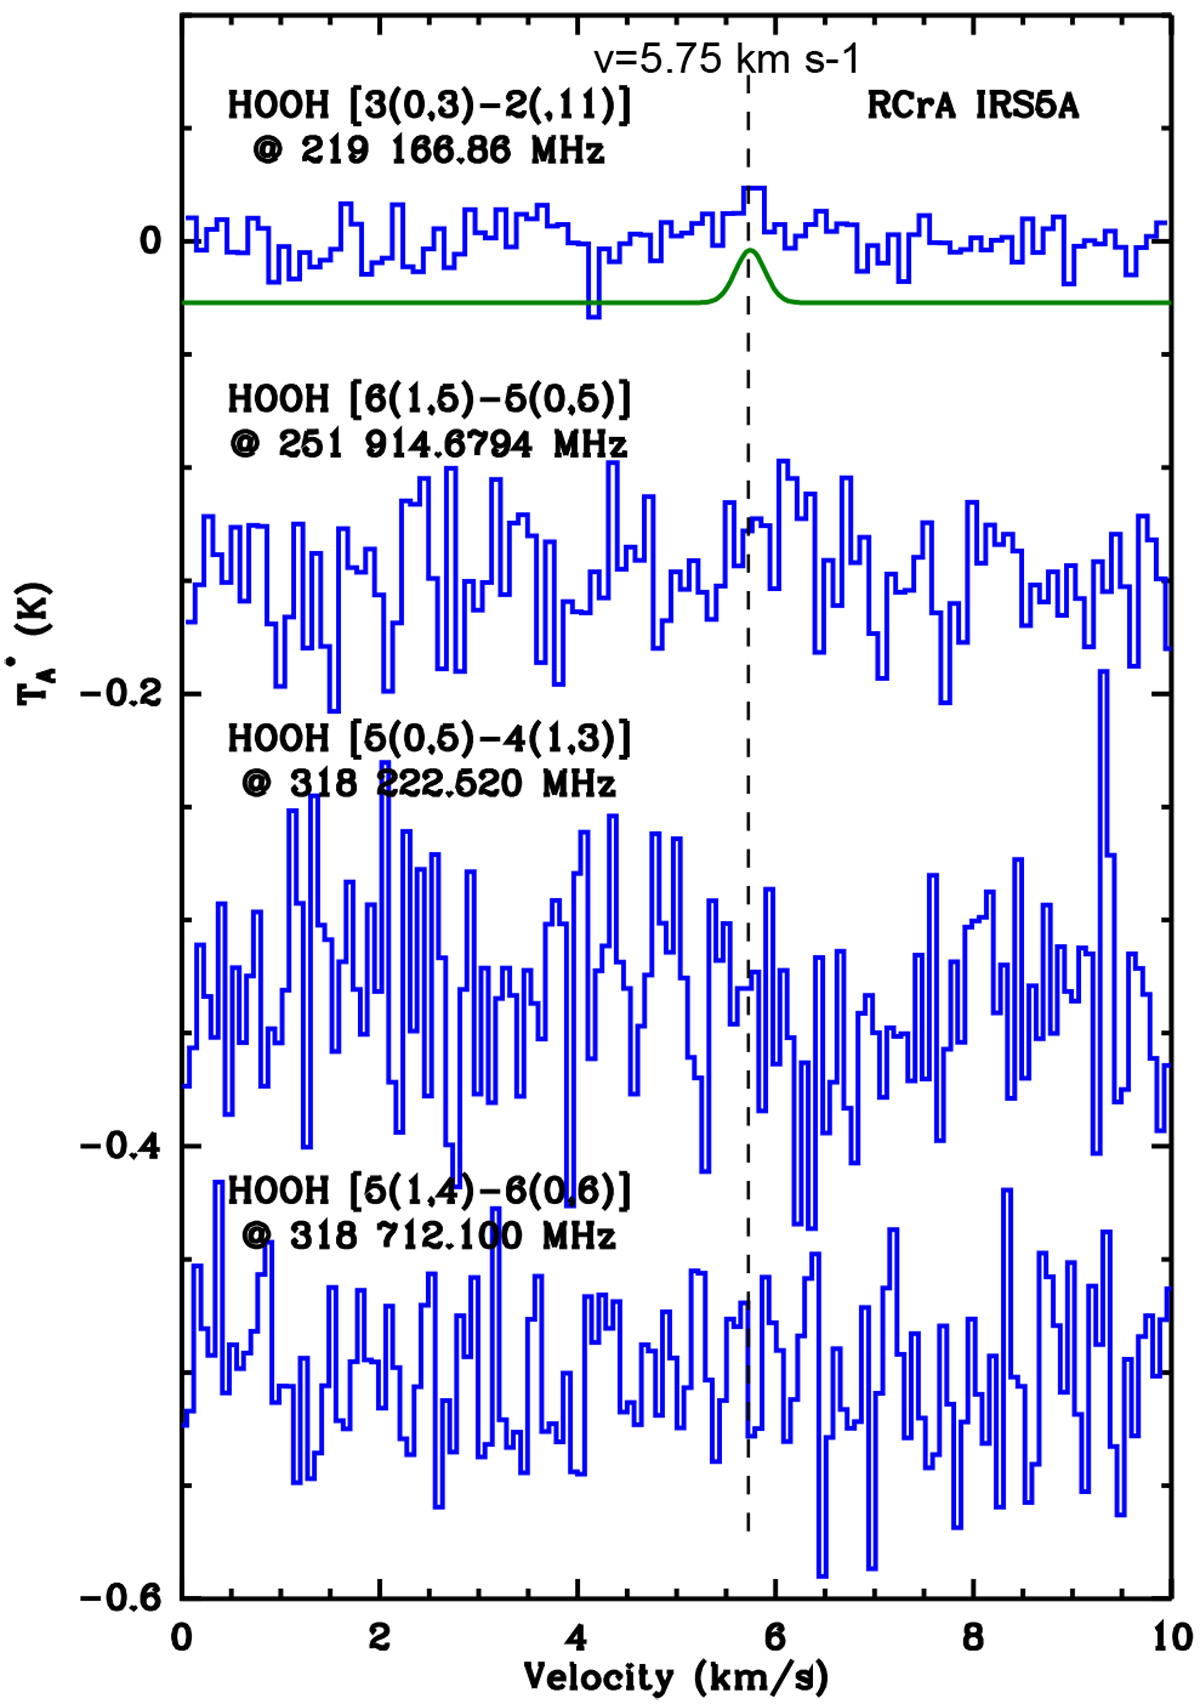
Region with HOOH transitions toward R CrA-IRS 5A. The green line indicates the HOOH line position. Its line intensity is consistent with the rms level. All spectra have the same intensity scale, but (except for the first) are plotted with an intensity offset.
Current usage metrics show cumulative count of Article Views (full-text article views including HTML views, PDF and ePub downloads, according to the available data) and Abstracts Views on Vision4Press platform.
Data correspond to usage on the plateform after 2015. The current usage metrics is available 48-96 hours after online publication and is updated daily on week days.
Initial download of the metrics may take a while.