Fig. 9
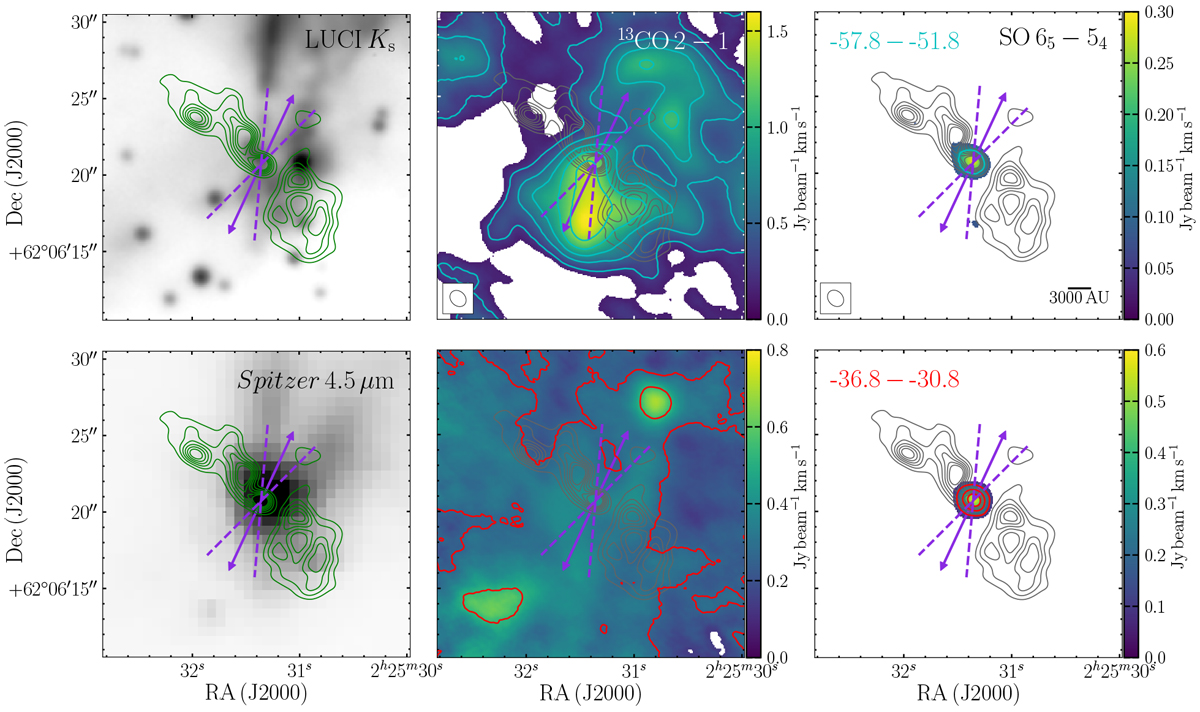
LBT LUCI Ks (top-left, data from Bik et al. 2012) and Spitzer IRAC 4.5 μm (bottom-left) continuum maps, as well as integrated emission in the blue (top) and red (bottom) line-wings of combined NOEMA and 30 m maps of 13CO 2−1 (middle) and SO 6−5 (right). The NOEMA continuum emission with natural weighting is shown as green (left) or grey (middle and right) contours from 5 to 30σ in 5σ intervals (σ = 0.95 mJy beam−1). The velocity integration windows for the 13CO and SO maps are indicated in the right-hand panels. The purple arrows indicate the tentatively identified direction of the outflow, with dashed lines used to highlight features which may trace the outflow cavity walls (see text for details).
Current usage metrics show cumulative count of Article Views (full-text article views including HTML views, PDF and ePub downloads, according to the available data) and Abstracts Views on Vision4Press platform.
Data correspond to usage on the plateform after 2015. The current usage metrics is available 48-96 hours after online publication and is updated daily on week days.
Initial download of the metrics may take a while.