Fig. 7
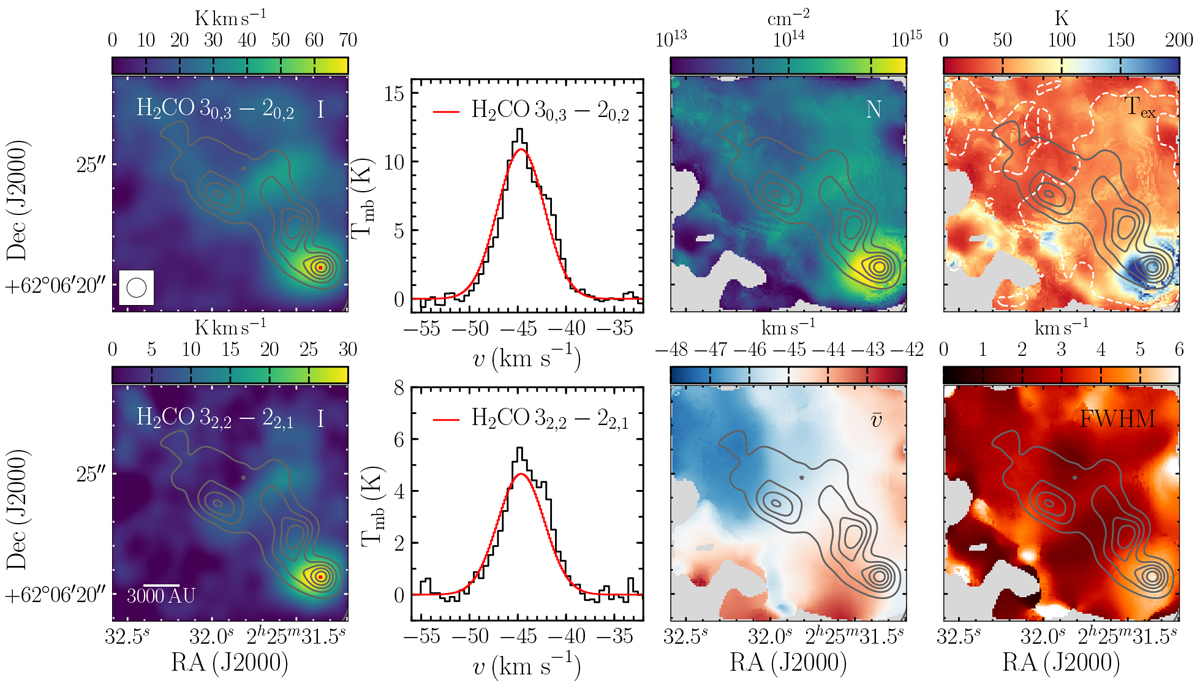
XCLASS fitting for H2CO in the filament. The panels show: integrated intensity (between −55.3 and −29.8 km s−1) in the H2CO 30,3 −20,2 (top-left) and 32,2−22,1 (bottom-left) transitions; example spectra (black) and XCLASS model fits (red) for H2CO 30,3 −20,2 (top-middle-left) and 32,2−22,1 (bottom-middle-left); column density in p-H2CO (top-middle-right); excitation temperature (top-right); peak velocity (bottom-middle-right); FWHM (bottom-right). The data for the two lines were resampled to a common spherical beam with a FWHM of 0.8′′, as shown in the top-right panel, and converted to the TMB scale. The grey contours in the maps show the continuum smoothed to the same resolution as the line data, starting at 5σ (σ = 0.81 mJy beam−1) and increasing to 45σ in 10σ steps. The spectra are extracted at the continuum peak (coordinates in Table 2), which is indicated in the left-hand panels with a red marker. A scale-bar is shown in the lower-left panel. The model results are only displayed for pixels where the integrated intensity for H2CO 30,3 −20,2 is above 5σmom0, with grey used to indicate those regions that do not meet this requirement. The white dashed contours in the map of excitation temperature indicate 3σmom0 for H2CO 32,2 −22,1.
Current usage metrics show cumulative count of Article Views (full-text article views including HTML views, PDF and ePub downloads, according to the available data) and Abstracts Views on Vision4Press platform.
Data correspond to usage on the plateform after 2015. The current usage metrics is available 48-96 hours after online publication and is updated daily on week days.
Initial download of the metrics may take a while.