Fig. 6
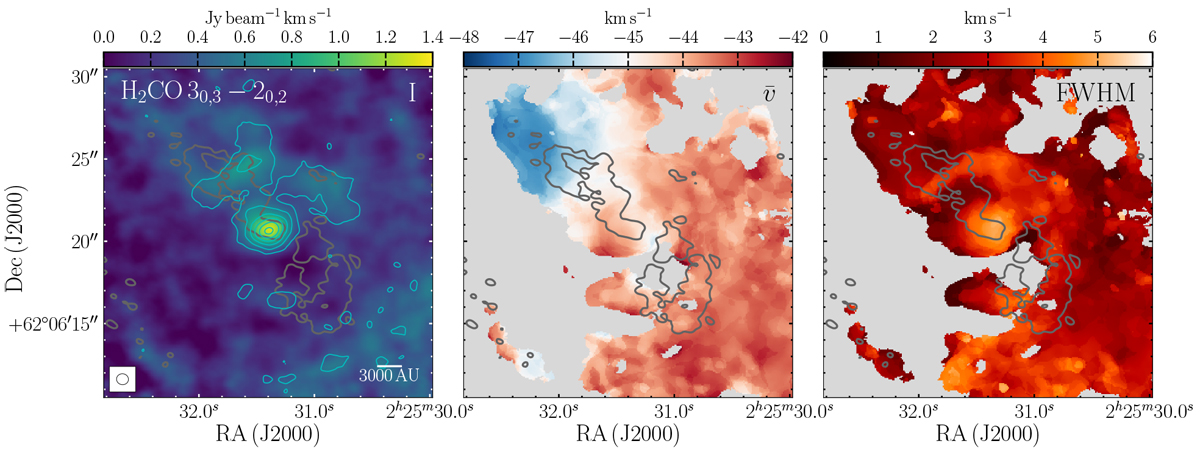
Maps of integrated intensity (moment 0, left, integrated between −55.3 and −29.8 km s−1), intensity-weighted velocity (moment 1, middle), and intensity-weighted FWHM (moment 2, right) for combined NOEMA and 30 m data for H2CO 30,3 −20,2, focusing on the filament. The grey contours indicate 5σ for the NOEMA 1.4 mm continuum with uniform weighting, as in the right-hand panel of Fig. 2. The cyan contours show the moment 0 of the H2CO 32,2 −22,1 transition, starting at 5σ (σ = 0.019 Jy beam−1 km s−1) and increasing to 25σ in 5σ steps. The mean velocity near the hot core is approximately −44.5 km s−1. The moment1 and 2 maps are calculated using channels above 4σ and only for pixels where the integrated intensity is also above 4σmom0, with grey used to indicate those regions that do not meet these requirements.
Current usage metrics show cumulative count of Article Views (full-text article views including HTML views, PDF and ePub downloads, according to the available data) and Abstracts Views on Vision4Press platform.
Data correspond to usage on the plateform after 2015. The current usage metrics is available 48-96 hours after online publication and is updated daily on week days.
Initial download of the metrics may take a while.