Fig. 5
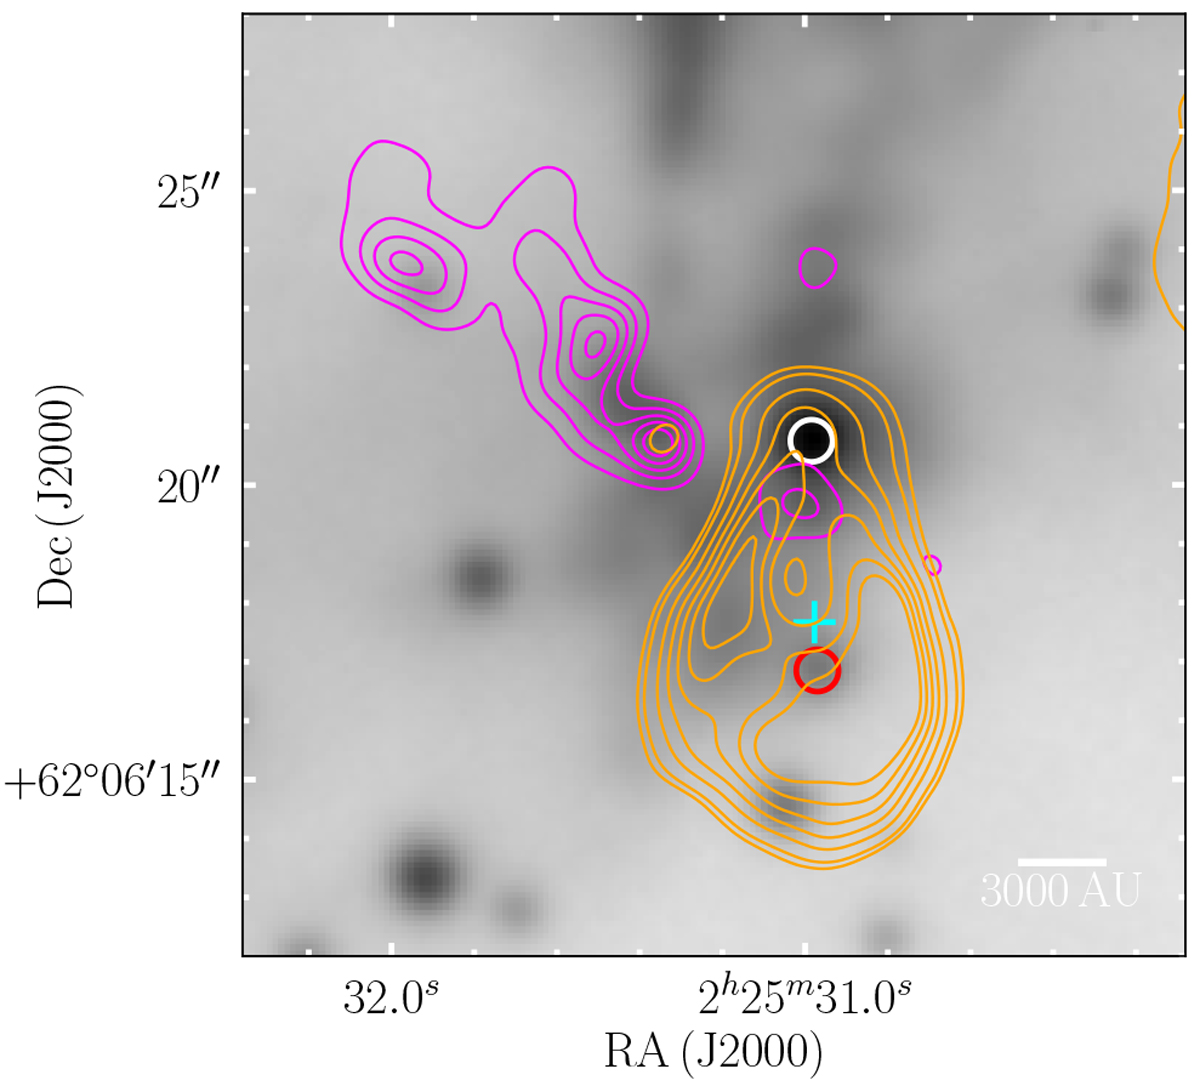
Comparison of near-IR Ks images from Bik et al. (2012, greyscale image, 0.9′′ resolution) with VLA 22.5 GHz radio continuum observations from Tieftrunk et al. (1997, orange contours) and free–free-subtracted NOEMA continuum at 220 GHz (magenta contours). The contour levels are the same as in Fig. 3. The cyan cross indicates the approximate geometrical centre of the UCH II region used as the centre for the radial analysis in Fig. 4, while the white circle indicates the source attributed by Bik et al. (2012) as powering W3 C and the red circle indicates the nearest source to the centre of the free–free emission, which is much redder.
Current usage metrics show cumulative count of Article Views (full-text article views including HTML views, PDF and ePub downloads, according to the available data) and Abstracts Views on Vision4Press platform.
Data correspond to usage on the plateform after 2015. The current usage metrics is available 48-96 hours after online publication and is updated daily on week days.
Initial download of the metrics may take a while.