Fig. 4
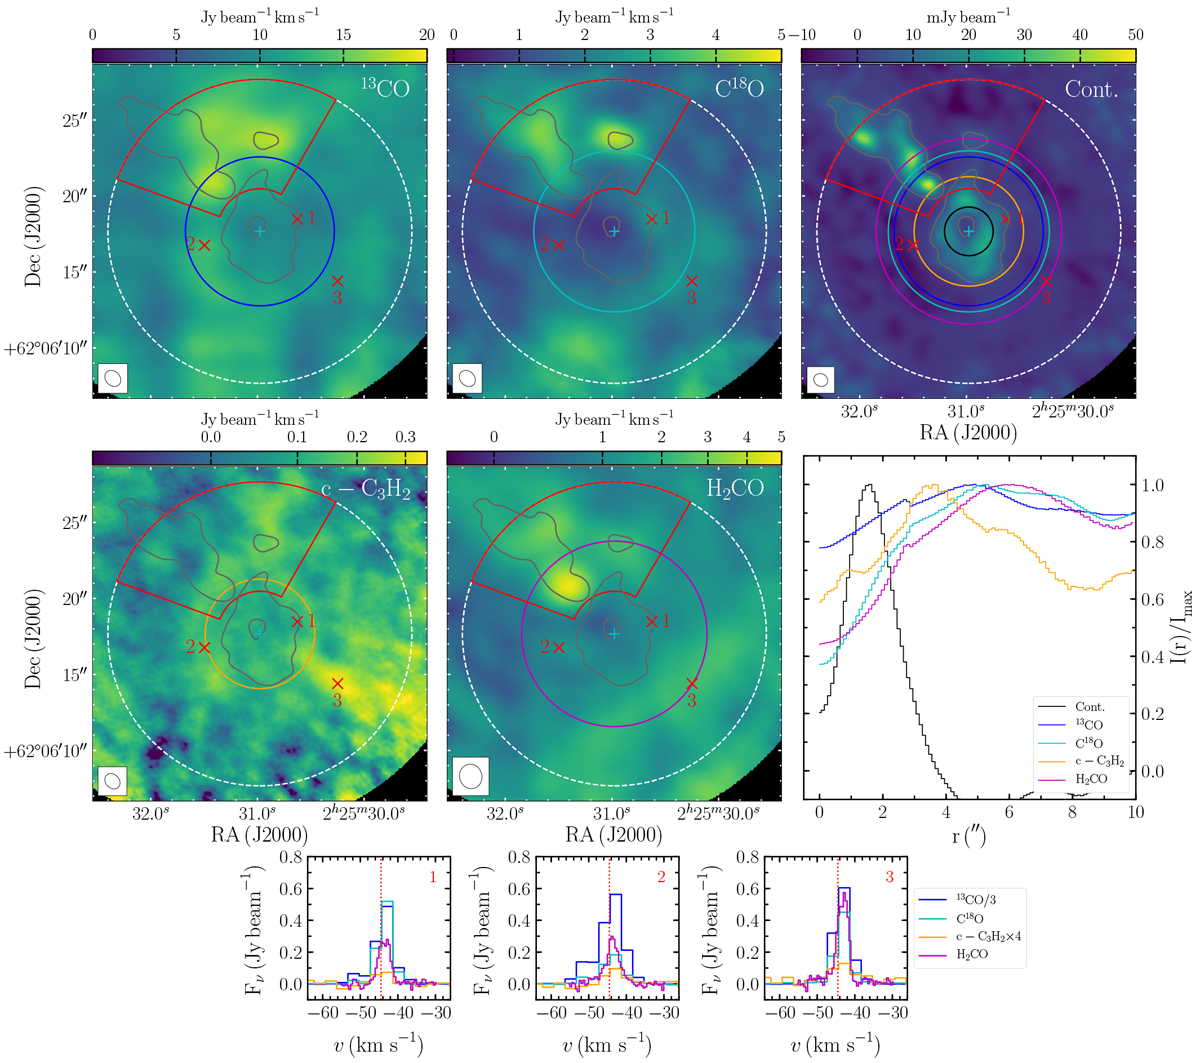
Spatial and spectral distribution of gas and dust around the UCH II region W3 C. The colour maps show the integrated intensity in the combined NOEMA and 30 m data for 13CO 2−1 (top-left), C18O 2−1 (top-centre),c-C3H2 6−5 (middle-left), and H2CO 30,3 −20,2 (middle-centre), and the NOEMA-only continuum (top-right). The velocity integration ranges are given in the text. The grey contours indicate 5σ for the continuum map (σrms = 0.95 mJy beam−1). The beam is shown in the lower-left corner of each map. c-C3H2 and H2CO are shown using a square-root intensity scheme to emphasise the extended emission. The middle-right panel shows the fractional intensity of the continuum and gas emission as a function of radius from the centre of W3 C, averaged over θ. The centre was determined by hand and is indicated on the maps with a cyan +. The region containing emission related to the hot core W3 IRS4 and cold filament, indicated with a red polygon on the maps, is excluded from the radial analysis, while the maximum radius is indicated with a white dashed circle. The radius of peak emission for each tracer is indicated with a circle on the relevant maps. Gas spectra at three representative positions, indicated in the maps with red crosses which are numbered in the continuum panel, are shown in the lower panels.
Current usage metrics show cumulative count of Article Views (full-text article views including HTML views, PDF and ePub downloads, according to the available data) and Abstracts Views on Vision4Press platform.
Data correspond to usage on the plateform after 2015. The current usage metrics is available 48-96 hours after online publication and is updated daily on week days.
Initial download of the metrics may take a while.