Fig. 3
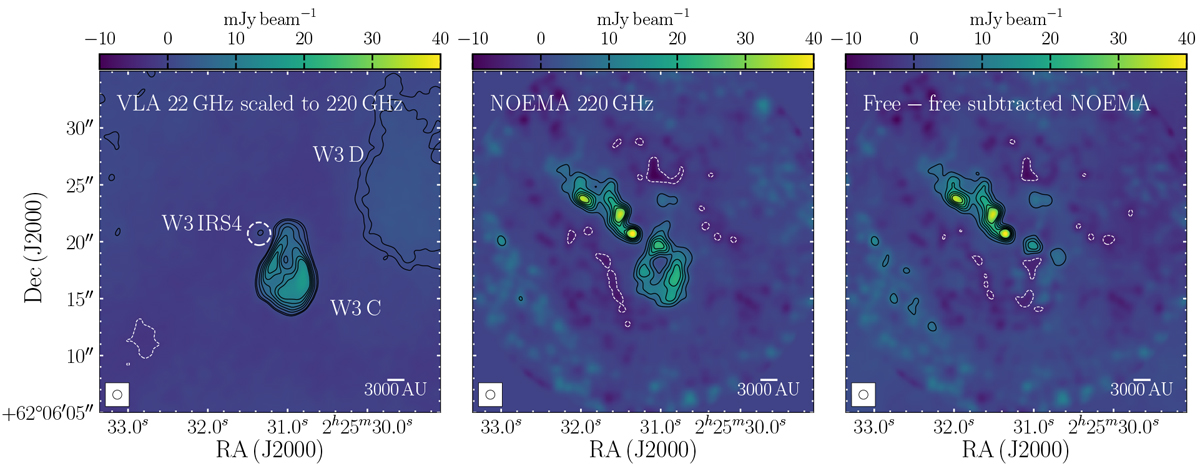
Radio contribution to the NOEMA continuum emission around W3 C. Left: VLA 22.5 GHz radio continuum observations from Tieftrunk et al. (1997) rescaled to 220 GHz (see text for details). W3 C is in the centre, with weak emission from W3 IRS4, highlighted with a white dashed circle, to the NE and W3 D further away to the NW. Middle: NOEMA 220 GHz continuum emission. Right: NOEMA continuum map after the free–free contribution has been estimated from the VLA observations and removed (see text for details). All data were convolved to the same 0.8 × 0.8′′ beam. The black contours indicate intensity iso-contours at 5−30σ (σ = 0.4, 0.8 and 1.4 mJy beam−1 from left to right), increasing in 5σ increments, with the addition of a lower contour at 3σ for the VLA observations to show that the weak emission at the location of W3 IRS4 is significant. The white-dashed contours indicate −5σrms.
Current usage metrics show cumulative count of Article Views (full-text article views including HTML views, PDF and ePub downloads, according to the available data) and Abstracts Views on Vision4Press platform.
Data correspond to usage on the plateform after 2015. The current usage metrics is available 48-96 hours after online publication and is updated daily on week days.
Initial download of the metrics may take a while.