Fig. C.4
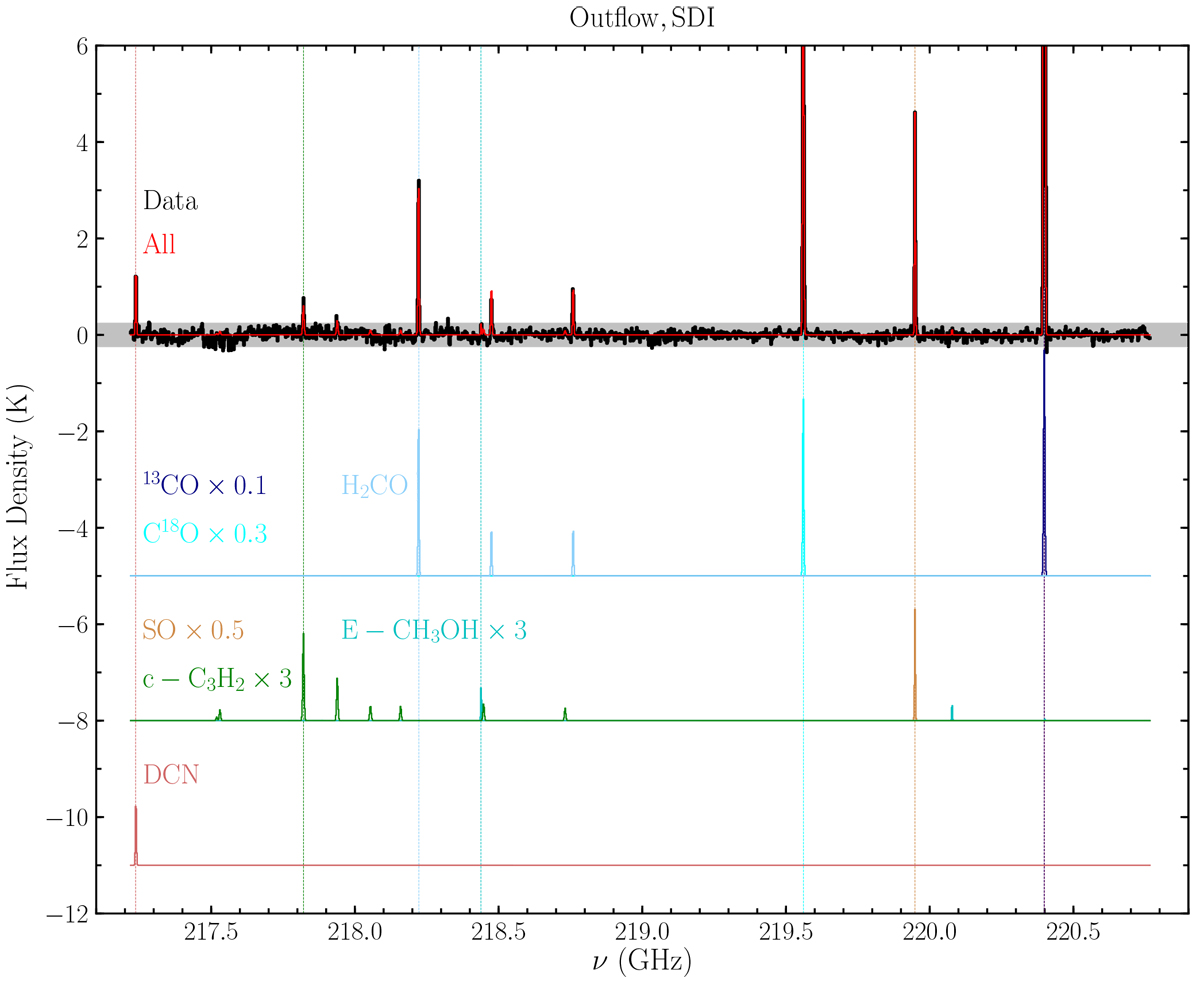
XCLASS fitting results for the SDI-imaged WideX data at the outflow position. The data are shown in black and the combined fit in red, with the fits for individual species are shown in different colours below, in some cases scaled for greater visibility, with common colours used for different chemical families (blue for organics, yellow and orange for sulphur-bearing, red for nitrogen-bearing, purple for species bearing both nitrogen and oxygen, dark green for hydro-carbons). Vertical dashed lines are shown at the position of the brightest transition of each species to guide the eye. The grey bands on the data spectrum indicate 3σ (σ=0.084 K).
Current usage metrics show cumulative count of Article Views (full-text article views including HTML views, PDF and ePub downloads, according to the available data) and Abstracts Views on Vision4Press platform.
Data correspond to usage on the plateform after 2015. The current usage metrics is available 48-96 hours after online publication and is updated daily on week days.
Initial download of the metrics may take a while.