Fig. C.1
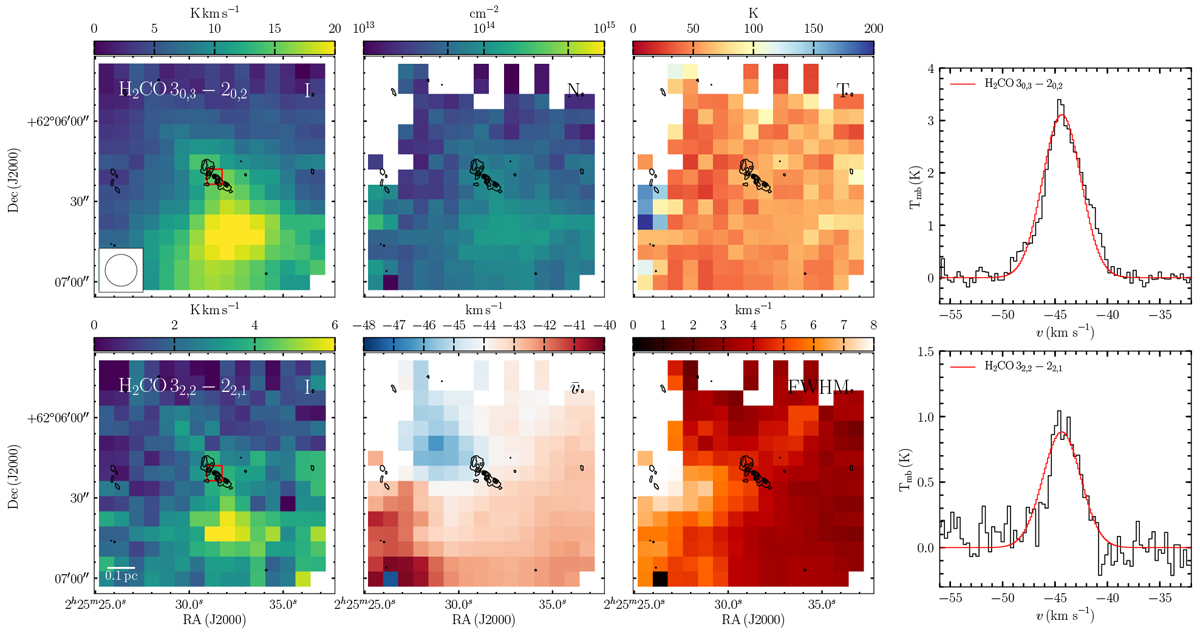
XCLASS fitting for the IRAM 30 m H2CO data. The panels show: integrated intensity (between −87.5 and 2.2 km s−1) in the H2CO 30,3 −20,2 (top-left) and 32,2−22,1 (bottom-left) transitions; column density in p-H2CO (top-middle-left); excitation temperature (top-middle-right); peak velocity (bottom-middle-left); FWHM (bottom-middle-right); example spectra (black) and XCLASS model fits (red) for H2CO 30,3 −20,2 (top-right) and 32,2−22,1 (bottom-right). The beam is shown in the top-left panel. The black contours in the maps show the NOEMA 1.4 mm continuum smoothed to a FWHM of 0.8′′, as used for the analysis of the combined H2CO data in Sect. 3.2, starting at 5σ and increasing to 45σ in 10σ steps. The spectra are extracted at the position covering the hot-core, which is indicated in the right-hand panels with a red square. A scale-bar is shown in the lower-left panel.
Current usage metrics show cumulative count of Article Views (full-text article views including HTML views, PDF and ePub downloads, according to the available data) and Abstracts Views on Vision4Press platform.
Data correspond to usage on the plateform after 2015. The current usage metrics is available 48-96 hours after online publication and is updated daily on week days.
Initial download of the metrics may take a while.