Fig. B.3
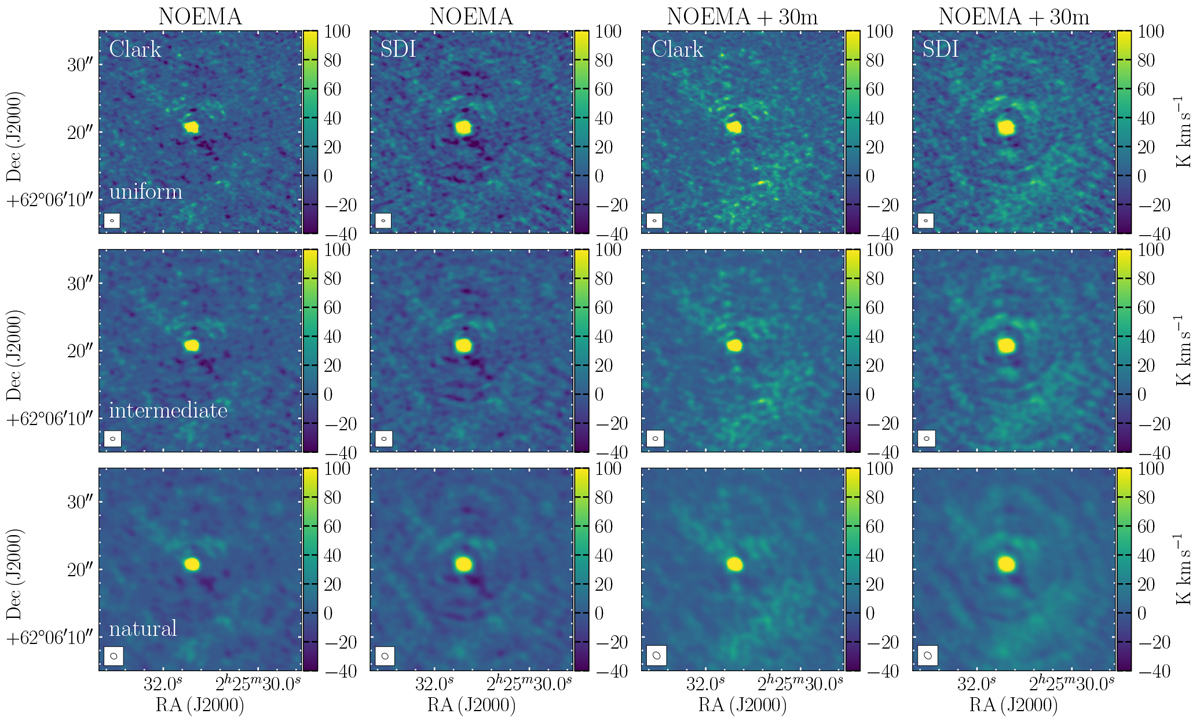
Comparison of the integrated intensity of SO 65−54 between −81.8 and −0.8 km s−1 with different imaging choices. The left and middle-left columns show results with only the NOEMA visibilities while the middle-right and right columns show the results with the 30 m short-spacing information included. The maps in the left and middle-right columns were imaged with the Clark algorithm while those in the middle-left and right columns were imaged with the SDI algorithm. The top row was imaged with uniform weighting, the middle row using a GILDAS-robust parameter of 3 to give an intermediate beam-size, while the bottom row using natural weighting. The intensity scale is chosen to show the extended emission, with the peak intensity for the hot core being between ~240 and ~790 K km s−1, depending on the method.
Current usage metrics show cumulative count of Article Views (full-text article views including HTML views, PDF and ePub downloads, according to the available data) and Abstracts Views on Vision4Press platform.
Data correspond to usage on the plateform after 2015. The current usage metrics is available 48-96 hours after online publication and is updated daily on week days.
Initial download of the metrics may take a while.