Fig. B.2
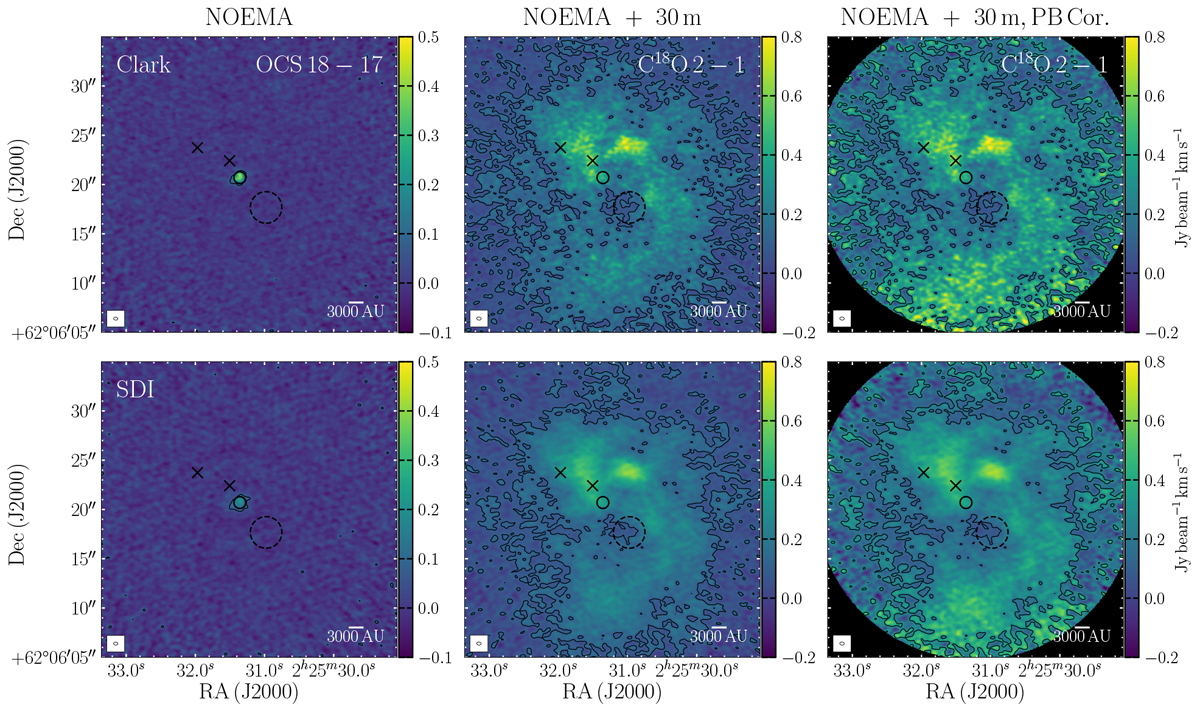
Integrated intensity (0th moment) maps of OCS 18−17 (left, between −55.3 and −29.8 km s−1) and C18O 2−1 (middle and right, between −81.8 and −0.8 km s−1) for data images with the Clark (top) and SDI (bottom) clean algorithms. All are imaged with uniform weighting. The OCS map is from only NOEMA data while the C18O is merged NOEMA and 30 m data. The C18O maps are without (middle) and with (right) primary beam correction, where in the latter case the data have been truncated at the FWHM of the primary beam. The black contours indicate 5σ, where σ = 13.8 (OCS, Clark), 12.6 (OCS, SDI), 19.0 (C18O before primary-beam correction, Clark), and 20.0 mJy beam−1 km s−1 (C18O before primary-beam correction, SDI). The black circle, dashed circle and crosses indicate the positions of W3 IRS4, W3 C and the two cold cores, as indicated in Fig. 2.
Current usage metrics show cumulative count of Article Views (full-text article views including HTML views, PDF and ePub downloads, according to the available data) and Abstracts Views on Vision4Press platform.
Data correspond to usage on the plateform after 2015. The current usage metrics is available 48-96 hours after online publication and is updated daily on week days.
Initial download of the metrics may take a while.