Fig. B.1
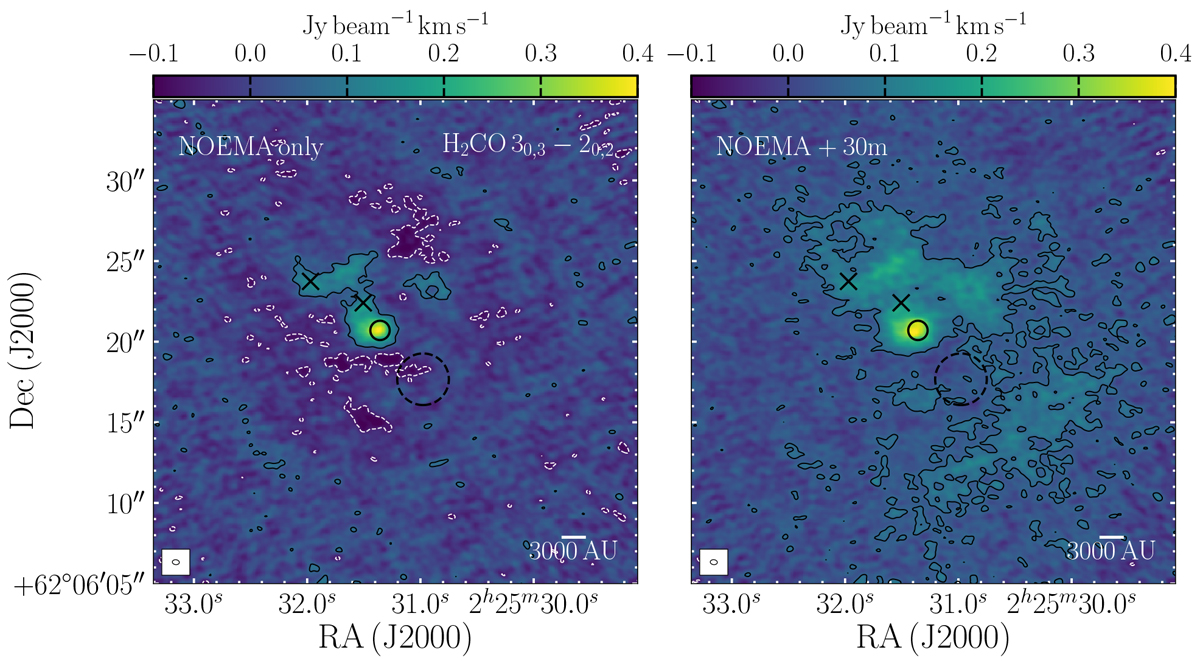
Integrated intensity (0th moment, integrating between −55.3 and −29.8 km s−1) maps of H2CO 30,3 −20,2 imaged with the SDI algorithm (see text for more details) and uniform weighting for NOEMA only (left) andmerged NOEMA and 30 m data (right). The black-solid and white-dashed contours indicate 5σ and −5σ, where σ = 12.5 and 12.6 mJy beam−1 km s−1 for the NOEMA only and the merged data respectively. The black circle, dashed circle and crosses indicate the positions of W3 IRS4,W3 C and the two cold cores, as indicated in Fig. 2.
Current usage metrics show cumulative count of Article Views (full-text article views including HTML views, PDF and ePub downloads, according to the available data) and Abstracts Views on Vision4Press platform.
Data correspond to usage on the plateform after 2015. The current usage metrics is available 48-96 hours after online publication and is updated daily on week days.
Initial download of the metrics may take a while.