Fig. A.2
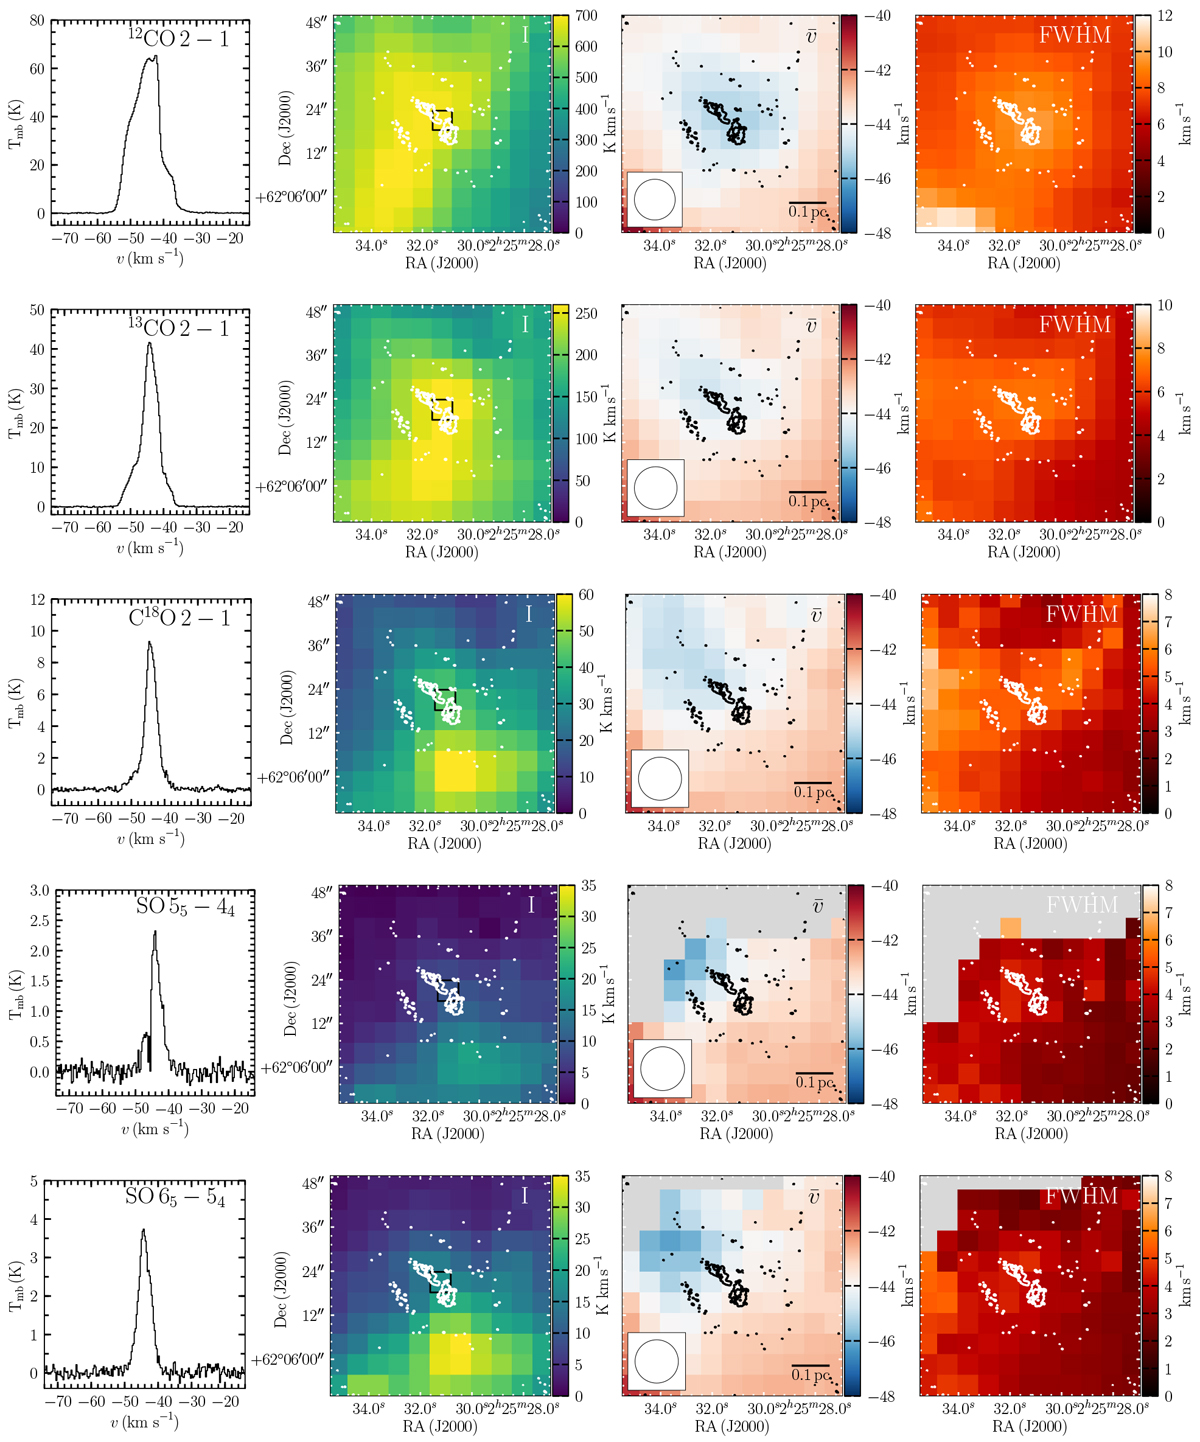
Overview of the IRAM 30 m data for selected lines, one per row. For each transition the panels show a spectrum at the source centre (left), as well as maps of the integrated intensity (moment 0, middle-left, between −87.5 and 2.2 km s−1), intensity-weighted velocity (moment 1, middle-right), and intensity-weighted line FWHM (moment 2, right). The position of the spectrum is indicated on the left-hand panel by a black square. The contours in the three maps indicate the NOEMA 1.4 mm continuum with uniform weighting, as in the right-hand panel of Fig. 2. The beam-size and a scale bar are given in the middle-left panel. For the middle-left and middle-right panels, values are only calculated where the spectrum has a peak intensity above 3σ, with grey used to indicate those regions that do not meet this requirement.
Current usage metrics show cumulative count of Article Views (full-text article views including HTML views, PDF and ePub downloads, according to the available data) and Abstracts Views on Vision4Press platform.
Data correspond to usage on the plateform after 2015. The current usage metrics is available 48-96 hours after online publication and is updated daily on week days.
Initial download of the metrics may take a while.