Fig. 2
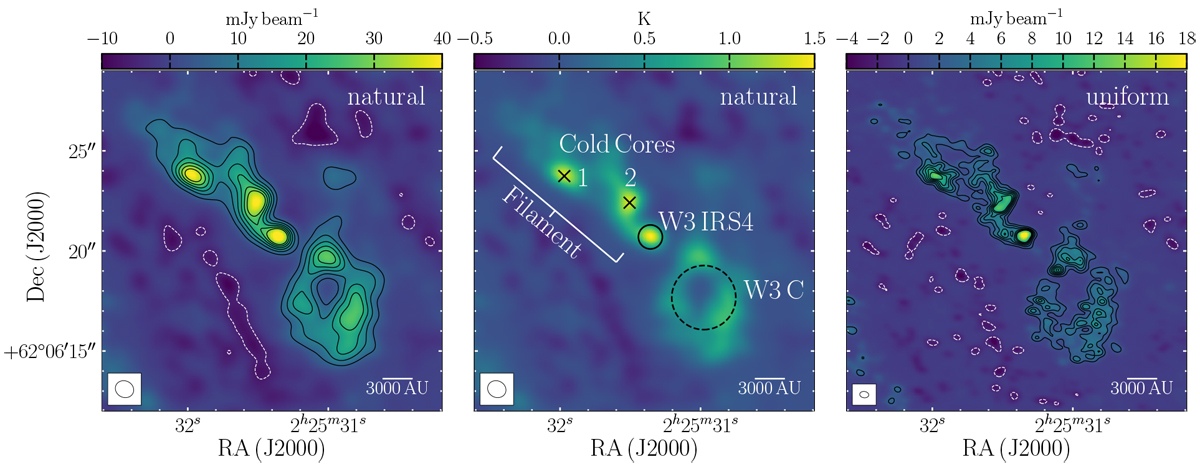
NOEMA 1.4 mm continuum intensity maps of the W3 IRS4 region, imaged with the Clark algorithm (see text for more details) and with natural (left and middle) and uniform (right) weighting. The beam sizes are 0.94′′ × 0.82′′ and 0.45′′ × 0.32′′ respectively, shown in the lower-left of each panel. The black contours indicate intensity iso-contours at 5, 10, 15, 20, 25 and 30σrms (σrms = 0.95 and 0.27 mJy beam−1 for the left and right panels, respectively), while white-dashed contours indicate −5σrms. The left and right panels are shown in flux density units while the middle panel has been converted to brightness temperature using the Rayleigh–Jeans approximation. The principle structures within the region are indicated in the middle panel: the hot core/MYSO W3 IRS4 with a solid black circle, the UCH II region W3 C with a dashed circle, two cold continuum sources with black crosses, and the filament with white lines. The coordinates are given in Table 2. Short-spacing information is not available for the continuum emission.
Current usage metrics show cumulative count of Article Views (full-text article views including HTML views, PDF and ePub downloads, according to the available data) and Abstracts Views on Vision4Press platform.
Data correspond to usage on the plateform after 2015. The current usage metrics is available 48-96 hours after online publication and is updated daily on week days.
Initial download of the metrics may take a while.