Fig. 17
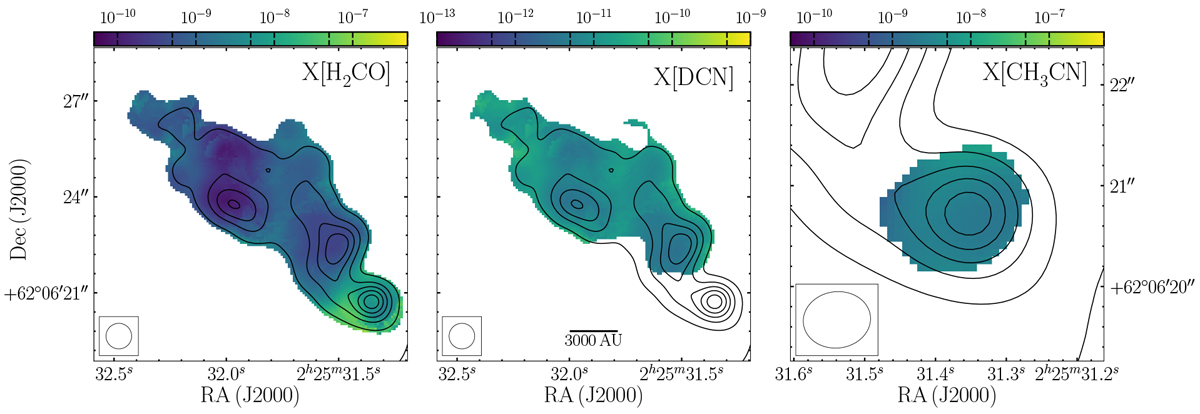
Abundance distribution of H2CO (left), DCN (middle), and CH3CN (right). The black contours in the maps show the continuum smoothed to the same resolution as the line data, starting at 5σ and increasing to 45σ in 10σ steps (σ = 0.81 mJy beam−1). The beam is shown in each panel and a scale-bar is shown in the middle panel. Abundances are only calculated where both the continuum emission and integrated intensity of the H2CO 303 −202 and DCN 3−2 lines are above 3σ and where CH3CN 124 −114 is above 5σ. The uncertainty in the abundances is conservatively estimated to be around a factor of two (see text for details).
Current usage metrics show cumulative count of Article Views (full-text article views including HTML views, PDF and ePub downloads, according to the available data) and Abstracts Views on Vision4Press platform.
Data correspond to usage on the plateform after 2015. The current usage metrics is available 48-96 hours after online publication and is updated daily on week days.
Initial download of the metrics may take a while.