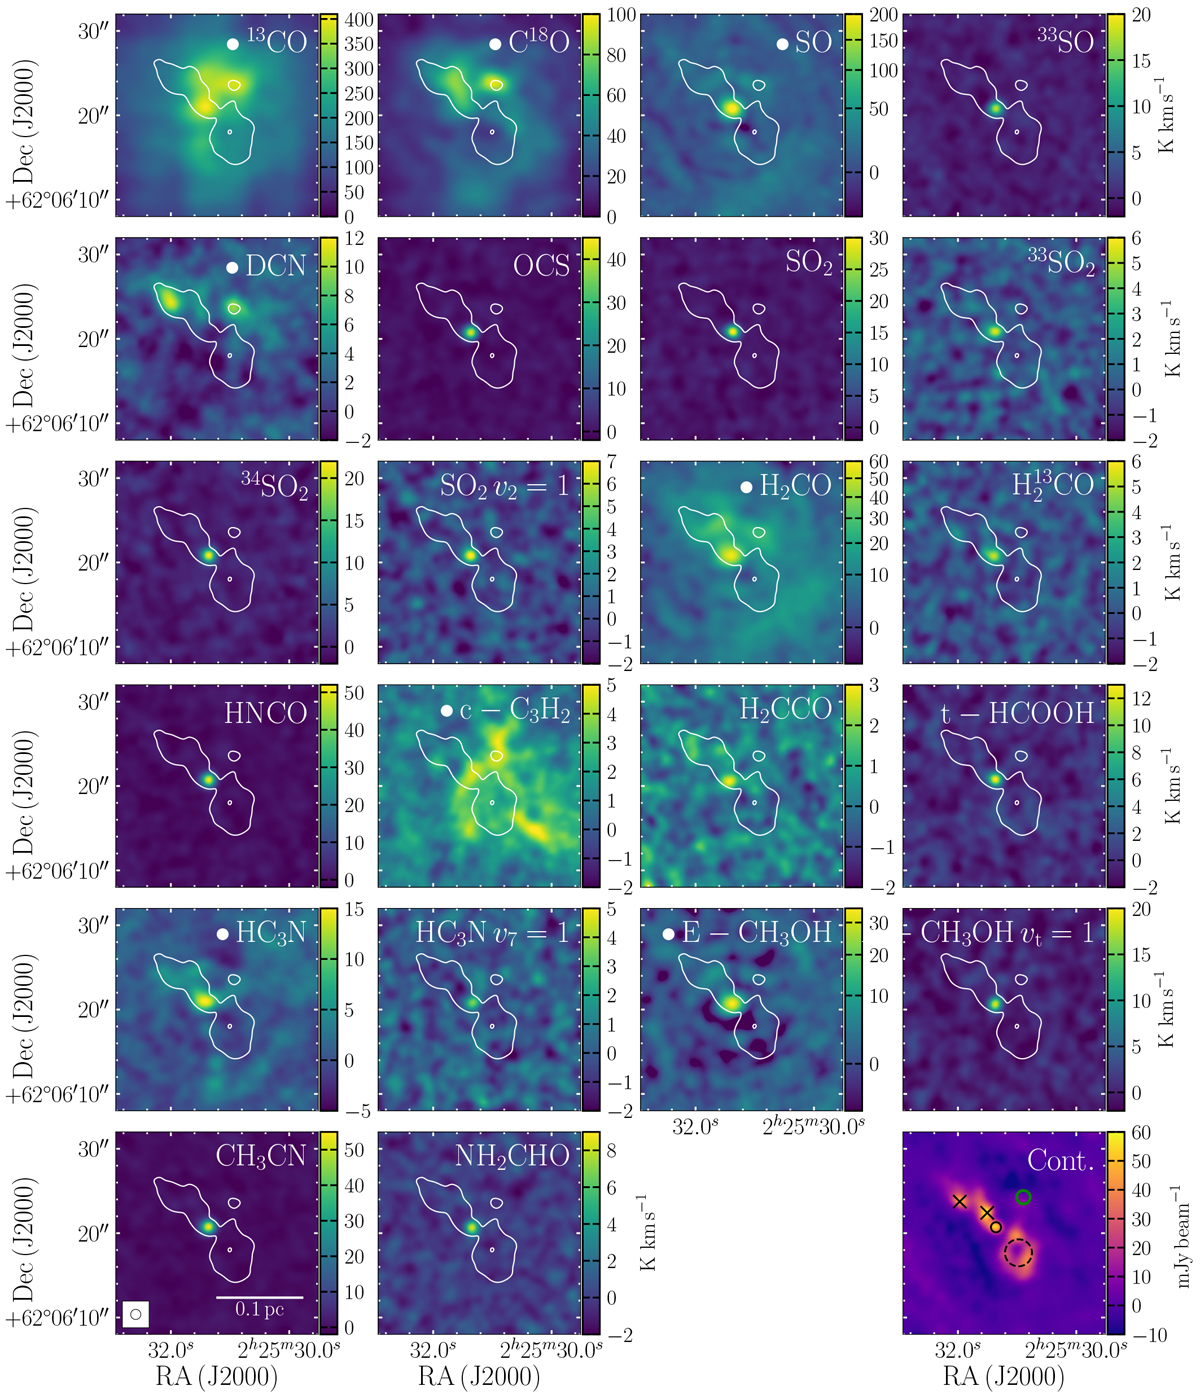
Fig. 15

Integrated intensity maps of the strongest unblended line of the principle detected molecular species, as well as the continuum (bottom-right), imaged with natural weighting and resampled to a circular 1.2′′ beam. The combined NOEMA and 30 m data, imaged using this SDI algorithm, were used for those species indicated with a • before the species label, while the NOEMA only data, imaged with the Clark algorithm, were used for all others. The white contour indicates 5σ on the continuum (σ = 1.56 mJy beam−1). In the continuum panel (bottom-right), the black dashed circle indicates the ring of continuum emission associated with W3 C, the black circle indicates the position of W3 IRS4 and the black crosses indicate the two continuum peaks associated with cold cores, as shown in Fig. 2. WideX spectra are fitted in (see Sect. 4.2) at the locations of the cold cores, IRS4 and a position in the outflow with a knot of continuum emission, indicated by the green circle.
Current usage metrics show cumulative count of Article Views (full-text article views including HTML views, PDF and ePub downloads, according to the available data) and Abstracts Views on Vision4Press platform.
Data correspond to usage on the plateform after 2015. The current usage metrics is available 48-96 hours after online publication and is updated daily on week days.
Initial download of the metrics may take a while.


