Fig. 13
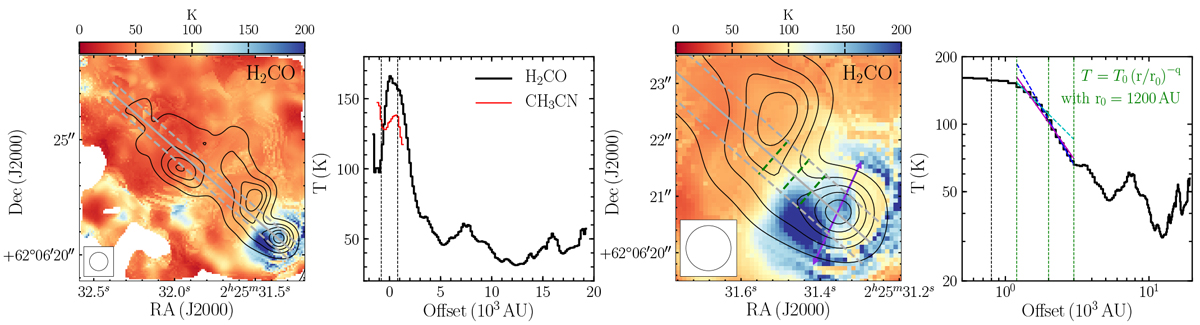
Temperature profile of H2CO as a function of offset from the MYSO and hot core W3 IRS4 along a slice which passes through the filament. Left: the position of the slice is indicated as a grey line on the temperature map from the XCLASS fitting of H2CO (see Sect. 3.2.1 and Fig. 7). The temperature at each position is calculated as an average over the beam FWHM of the map (shown in the lower-left corner, 0.8′′), indicated with the grey dashed lines. This profile for H2CO (black), and that for CH3CN (red), are shown in the middle-left panel. The middle-right panel shows a zoom-in focusing on IRS4, with the profile shown in logarithmic units in the right-hand panel. The green dashed lines in both panels indicate three boundaries, between which we perform power-law fits to the temperature profile. The solid magenta line shows the fit over the whole region, while the cyan and blue lines show the fits to only the inner and outer regions. These latter two fits are shown as solid lines in the regions where they are fit and dashed lines where they are extrapolated to the same region as the magenta line. The results of these fits are given in Table 7. The vertical dashed black lines in the middle-left and right-hand panels indicate the beam size. The black contours in the maps show the continuum at the same resolution as the H2CO data, starting at 5σ and increasing to 45σ in 10σ steps (σ = 0.81 mJy beam−1), while the purple arrow in the middle-right panel indicates the suggested direction of the outflow as in Fig. 9.
Current usage metrics show cumulative count of Article Views (full-text article views including HTML views, PDF and ePub downloads, according to the available data) and Abstracts Views on Vision4Press platform.
Data correspond to usage on the plateform after 2015. The current usage metrics is available 48-96 hours after online publication and is updated daily on week days.
Initial download of the metrics may take a while.