Fig. 12
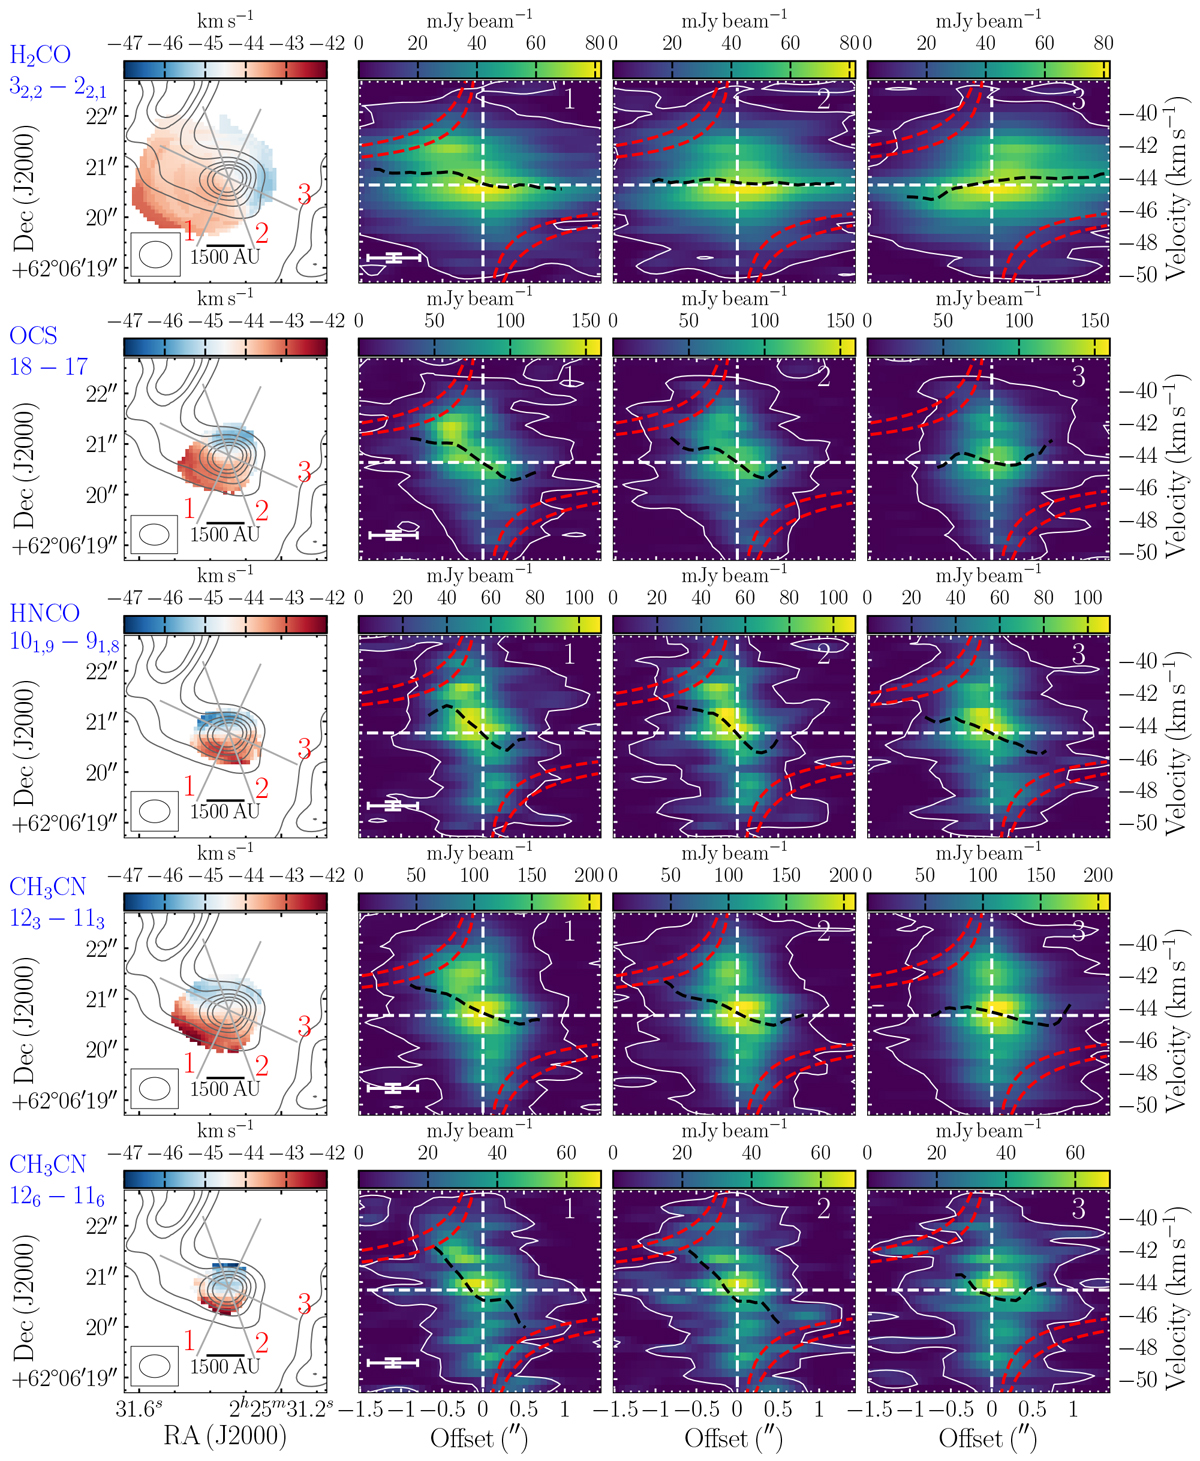
Moment 1 (left) and position-velocity (PV) maps for molecular gas around W3 IRS4. From top to bottom, each row shows the moment 1 map and PV cuts along three different axes (middle-left, middle-right and right), for H2CO 32,2 −22,1, OCS 18-17, HNCO 101,9−91,8, CH3 CN 123 −113, and CH3CN 126 −116. The three PV cuts, taken along the outflow axis (1), rotated by 45° (2), and perpendicular to it (3), are shown on the moment 1 maps with grey lines numbered in red, where each cut is averaged over a width similar to the beam perpendicular to the cut. The 5σ contour of the data in each PV diagram is indicated with a white solid contour, while white dashed horizontal and vertical lines indicate the vLSR and zero offset from the continuum peak. The spatial and spectral resolution of the PV diagrams is indicated with a white cross in the lower-left corner of PV diagram 1 in each row. The black dashed lines indicate the results of the same cut through the moment 1 map, while the red dashed lines indicate what would be expected for Keplerian motion with a central mass of 10 and 20 M⊙. The black contours in the moment 1 maps show the continuum, as in Fig. 11.
Current usage metrics show cumulative count of Article Views (full-text article views including HTML views, PDF and ePub downloads, according to the available data) and Abstracts Views on Vision4Press platform.
Data correspond to usage on the plateform after 2015. The current usage metrics is available 48-96 hours after online publication and is updated daily on week days.
Initial download of the metrics may take a while.