Fig. 11
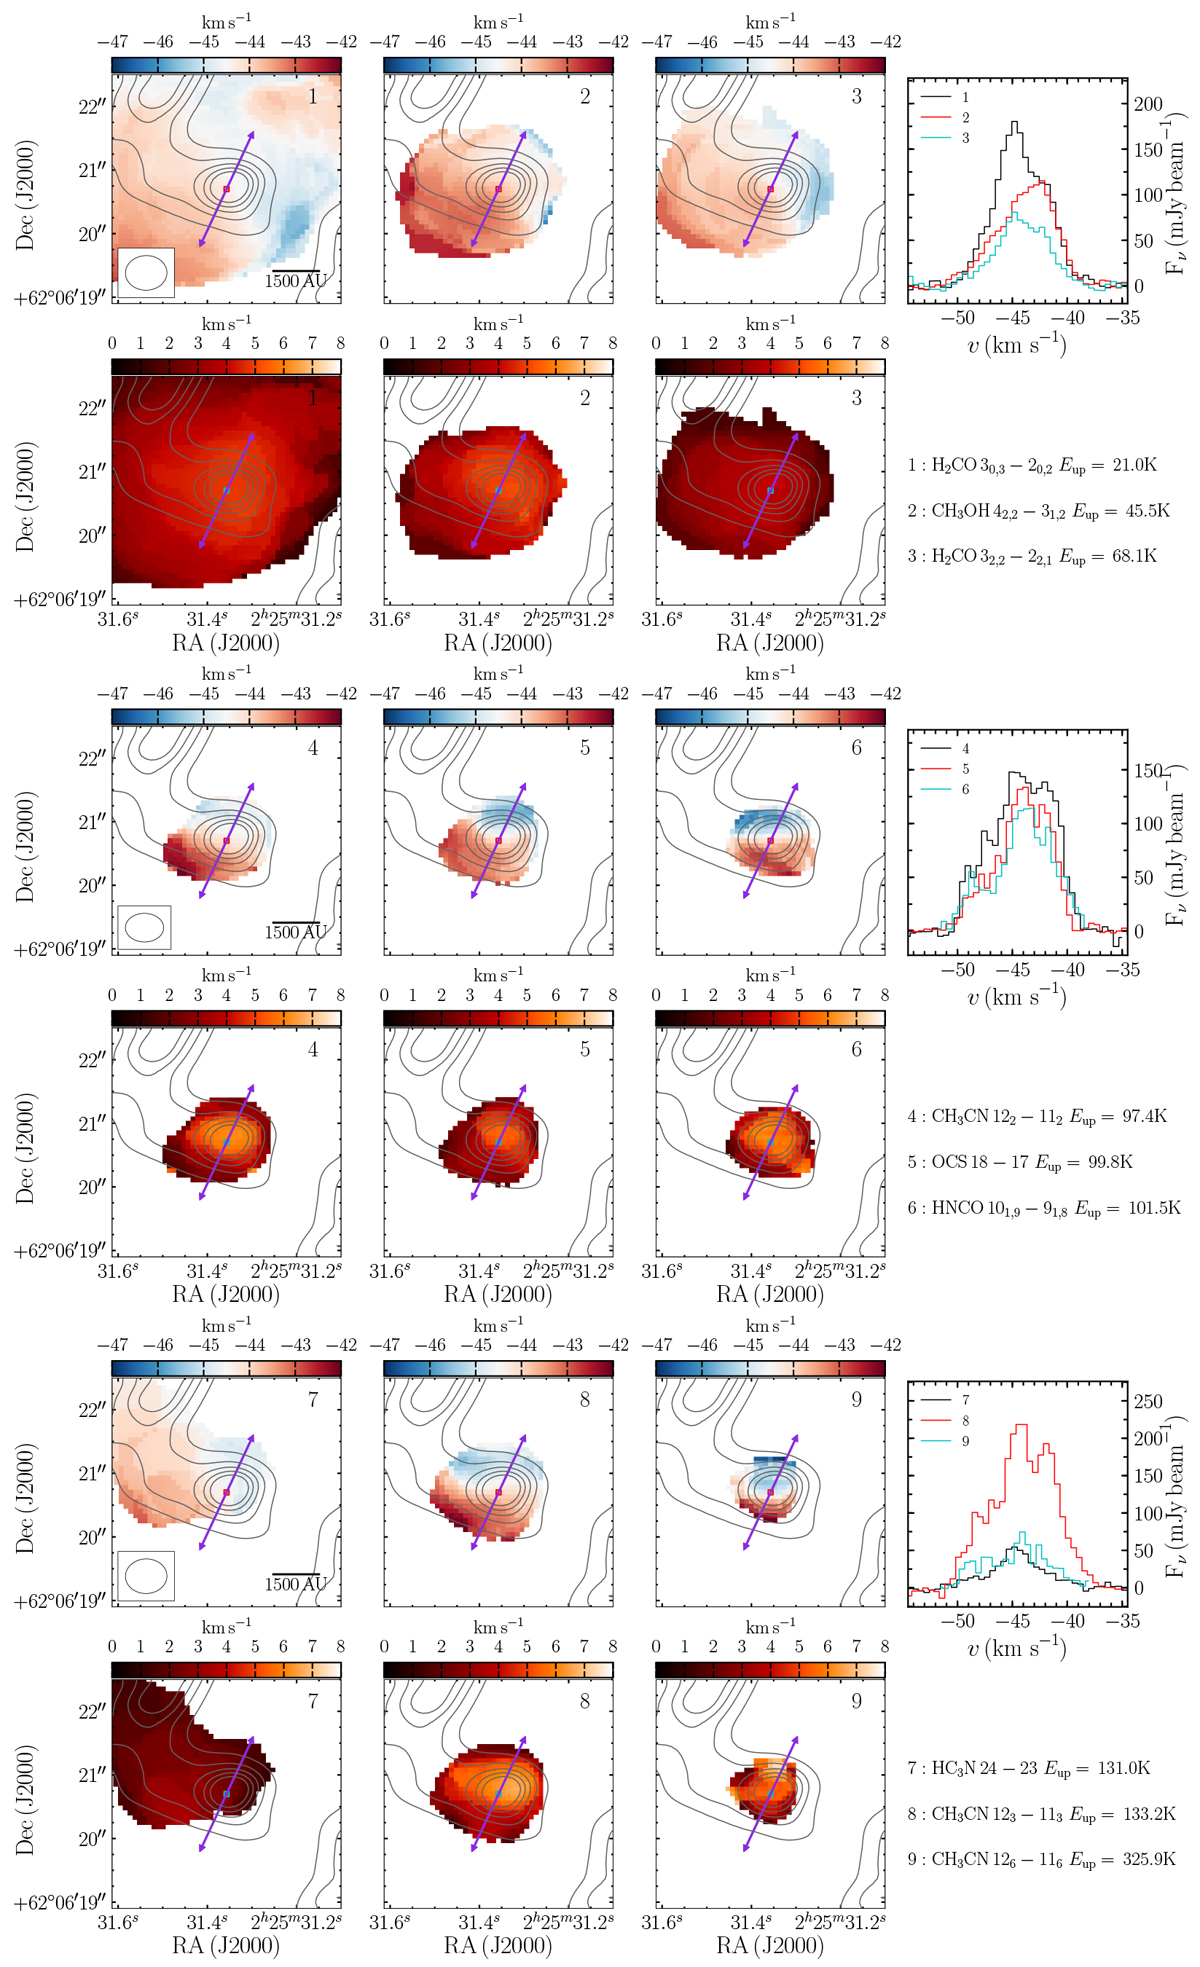
Intensity-weighted velocity (moment 1, top, third, and fifth rows) and intensity-weighted FWHM (moment 2, second, fourth, and sixth rows) maps of key species in the high velocity-resolution data, along with their spectra at the continuum peak, as indicated with a red box on the moment 1 maps and a cyan box on the moment 2 maps. The lines are shown from left to right and top to bottom in order of increasing transition upper energy level (Eup). The NOEMA continuum emission with similar beam-size to the data are shown as grey contours from 5 to 45σ in 10σ intervals (σ = 0.43 mJy beam−1) in the maps, which are clipped at 5σ of the corresponding integrated intensity map. The purple arrows indicate the suggested direction of the outflow as in Fig. 9.
Current usage metrics show cumulative count of Article Views (full-text article views including HTML views, PDF and ePub downloads, according to the available data) and Abstracts Views on Vision4Press platform.
Data correspond to usage on the plateform after 2015. The current usage metrics is available 48-96 hours after online publication and is updated daily on week days.
Initial download of the metrics may take a while.