Fig. 10
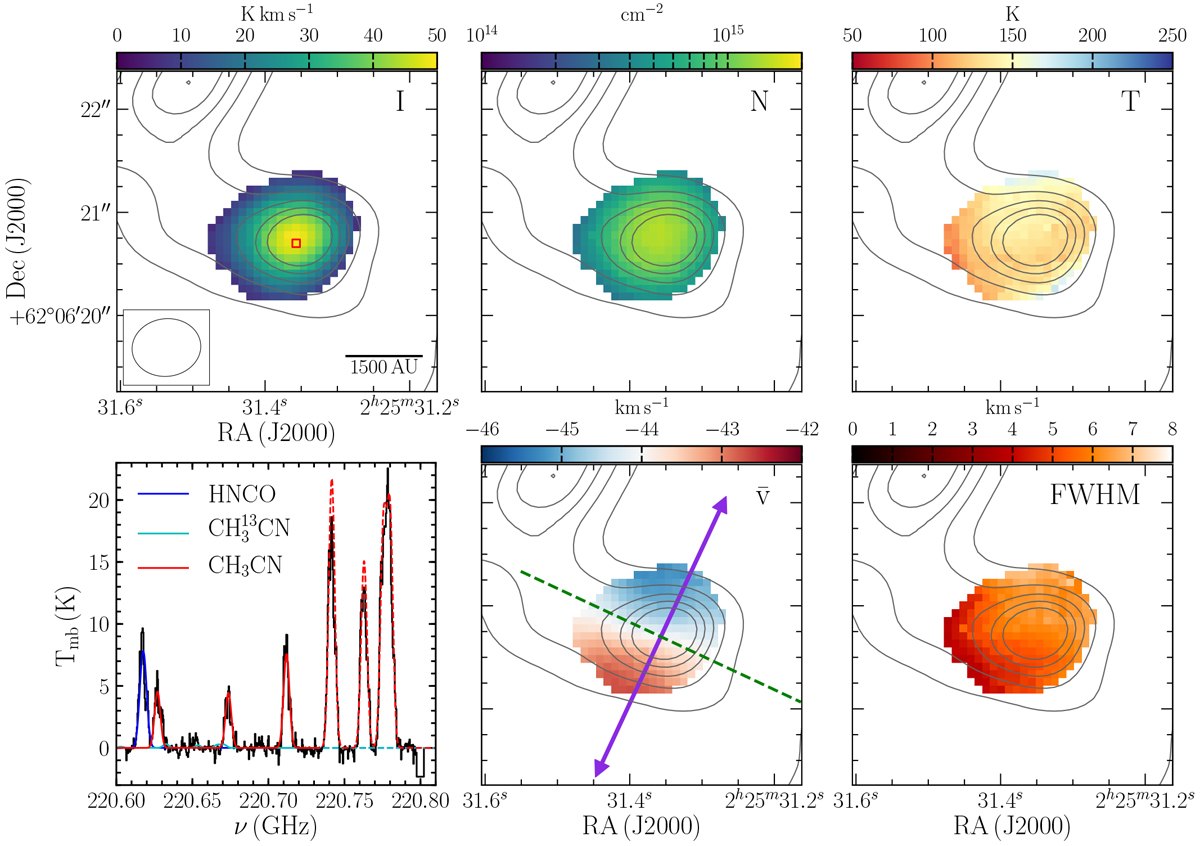
XCLASS fitting for CH3CN in the hot core. The panels show: integrated intensity in the CH3CN 124 −114 transition (top-left); column density of CH3CN (top-middle); excitation temperature (top-right); peak velocity (bottom-middle); FWHM (bottom-right); example spectra (black) and XCLASS model fits (bottom-left) for CH3 CN (red), CH![]() CN (cyan), and HNCO (blue). As k = 0−3 of CH3 CN were notincluded in the fit, the resulting fit solution for those transitions is shown with a dashed line. The data were imaged with an intermediate weighting between uniform and natural in order to provide a good balance between sensitivity and resolution, resulting in a beam size of 0.67′′ × 0.56′′ (PA = −83.2°), as shown in the top-left panel with a scale-bar, and converted to the Tmb scale. The black contours in the maps show the continuum at the same resolution as the line data, starting at 5σ and increasing to 45σ in 10σ steps (σ = 0.48 mJy beam−1). The spectra are extracted at the continuum peak, which is indicated in the top-left panel with a red square. All maps are clipped to show only results where the integrated intensity of the CH3 CN 124 −114 is above 5σ (σ = 1.27 K kms). The purple arrow indicates the suggested direction of the outflow as in Fig. 9, while the green dashed line is perpendicular to this axis.
CN (cyan), and HNCO (blue). As k = 0−3 of CH3 CN were notincluded in the fit, the resulting fit solution for those transitions is shown with a dashed line. The data were imaged with an intermediate weighting between uniform and natural in order to provide a good balance between sensitivity and resolution, resulting in a beam size of 0.67′′ × 0.56′′ (PA = −83.2°), as shown in the top-left panel with a scale-bar, and converted to the Tmb scale. The black contours in the maps show the continuum at the same resolution as the line data, starting at 5σ and increasing to 45σ in 10σ steps (σ = 0.48 mJy beam−1). The spectra are extracted at the continuum peak, which is indicated in the top-left panel with a red square. All maps are clipped to show only results where the integrated intensity of the CH3 CN 124 −114 is above 5σ (σ = 1.27 K kms). The purple arrow indicates the suggested direction of the outflow as in Fig. 9, while the green dashed line is perpendicular to this axis.
Current usage metrics show cumulative count of Article Views (full-text article views including HTML views, PDF and ePub downloads, according to the available data) and Abstracts Views on Vision4Press platform.
Data correspond to usage on the plateform after 2015. The current usage metrics is available 48-96 hours after online publication and is updated daily on week days.
Initial download of the metrics may take a while.