Fig. 1
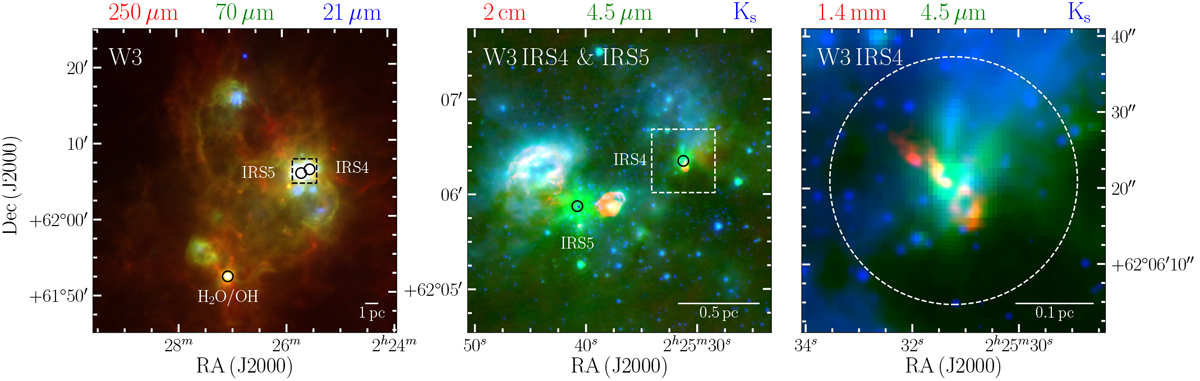
Overview of the W3 star formation region showing the larger-scale context of W3 IRS4. Left: infrared three-colour image of W, where red is Herschel Hi-GAL (Molinari et al. 2016) 250 μm, green is Hi-GAL 70 μm, and blue is MSX 21 μm (Price et al. 2001). The three brightest far-IR sources, W3 OH/H2O, W3 IRS4, and W3 IRS5, are indicated with black circles. The region for the middle panel is indicated with a black dashed box.Middle: three-colour image of W3 IRS4 and IRS5, where red is 14.9 GHz radio free-free continuum from Tieftrunk et al. (1997) to emphasise ionised gas, green is Spitzer IRAC 4.5 μm (Ruch et al. 2007), and blue is Large Binocular Telescope (LBT, Hill et al. 2006) Ks data from Bik et al. (2012). The locations of W3 IRS4 and IRS5 are indicated with black circles, with the white dashed box indicating the region covered in the left-hand panel. Right: three-colour image focusing on W3 IRS4, where red is the NOEMA 1.4 mm continuum presented in this paper, imaged with natural weighting, while green and red are as in the middle panel. The dashed white circle shows the full-width half-maximum of the primary beam for the NOEMA continuum observations.
Current usage metrics show cumulative count of Article Views (full-text article views including HTML views, PDF and ePub downloads, according to the available data) and Abstracts Views on Vision4Press platform.
Data correspond to usage on the plateform after 2015. The current usage metrics is available 48-96 hours after online publication and is updated daily on week days.
Initial download of the metrics may take a while.