Open Access
Fig. 10.
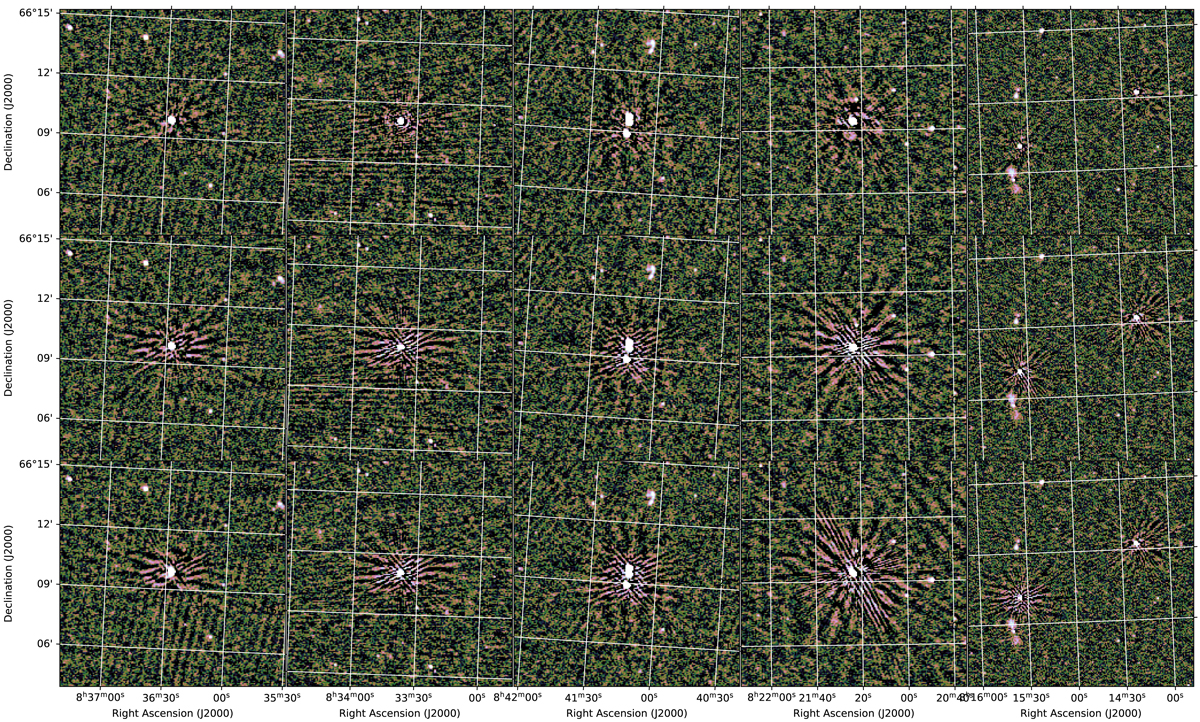
Comparison of direction dependent effects in regions far from a calibrator. Bottom row: archival LoTSS-DR2 image, the middle row shows the image when smooth_cal+slow_cal is applied, and the top row shows the final image with our inferred DDTEC screen applied. The column numbers correspond to the regions labelled in Fig. 2.
Current usage metrics show cumulative count of Article Views (full-text article views including HTML views, PDF and ePub downloads, according to the available data) and Abstracts Views on Vision4Press platform.
Data correspond to usage on the plateform after 2015. The current usage metrics is available 48-96 hours after online publication and is updated daily on week days.
Initial download of the metrics may take a while.