Fig. 5.
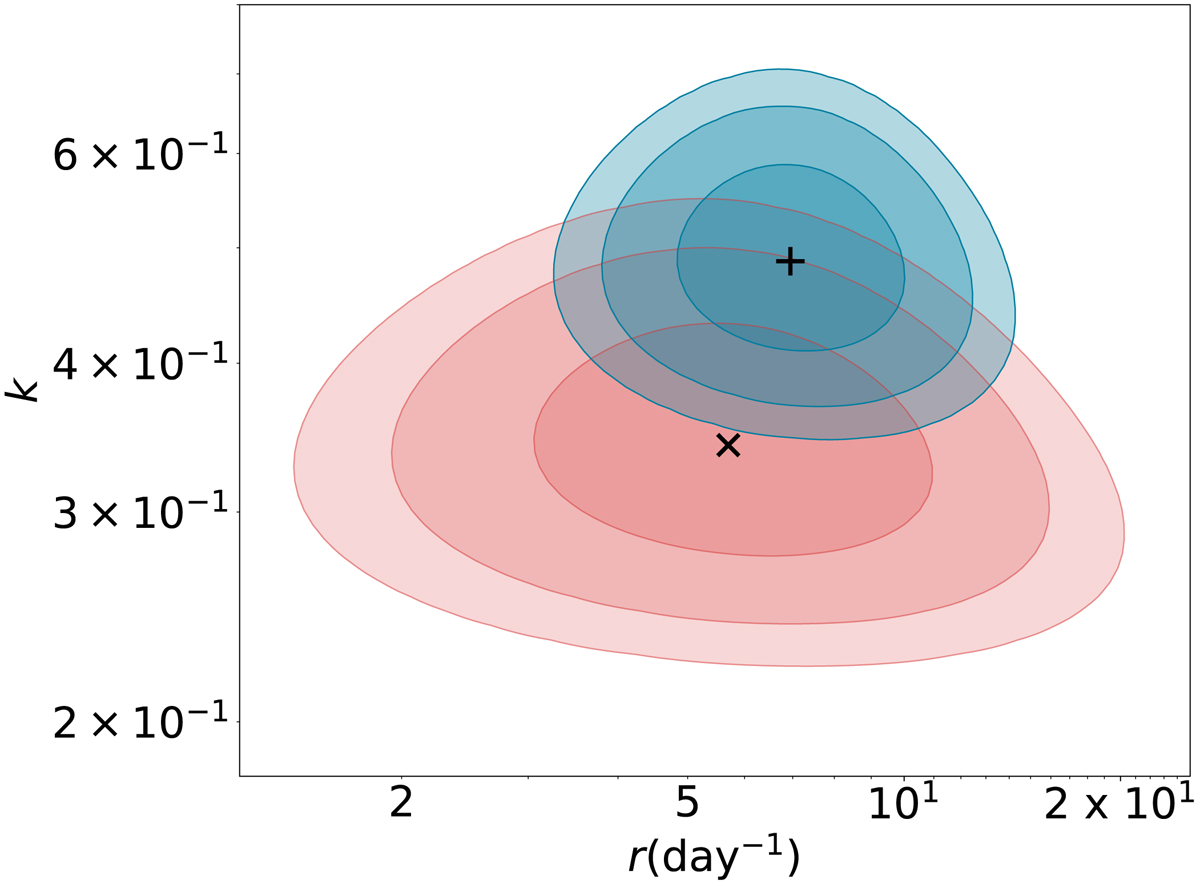
Posterior distribution of R1 burst rate and shape parameters. A lower k indicates a higher degree of clustering. The red and blue areas indicate the result from Oppermann et al. (2018) and this work, respectively. The contours indicate 1, 2, and 3σ limits on r and k. The best-fit parameters are indicated by the cross and plus.
Current usage metrics show cumulative count of Article Views (full-text article views including HTML views, PDF and ePub downloads, according to the available data) and Abstracts Views on Vision4Press platform.
Data correspond to usage on the plateform after 2015. The current usage metrics is available 48-96 hours after online publication and is updated daily on week days.
Initial download of the metrics may take a while.