Fig. 6
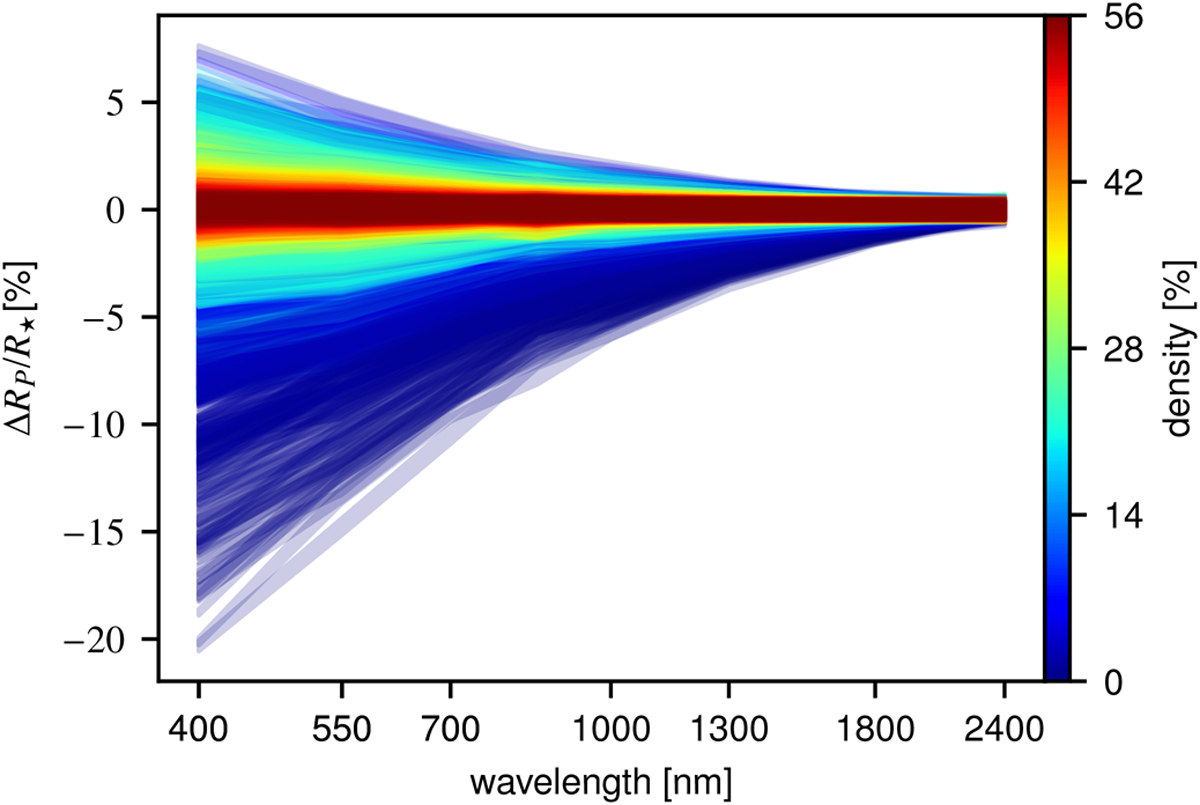
Similar to Fig. 2, but for 10 000 simulations with random active regions. However, unlike Fig. 2, here, we present the relative planet radius variation in with a percent. The density indicates for each line how many of the other lines share every point within the range of ΔRp ∕R⋆ ≤ 0.0005. Instead of the actual lines, the region of uncertainty for each transmission spectrum is plotted.
Current usage metrics show cumulative count of Article Views (full-text article views including HTML views, PDF and ePub downloads, according to the available data) and Abstracts Views on Vision4Press platform.
Data correspond to usage on the plateform after 2015. The current usage metrics is available 48-96 hours after online publication and is updated daily on week days.
Initial download of the metrics may take a while.