Fig. 1
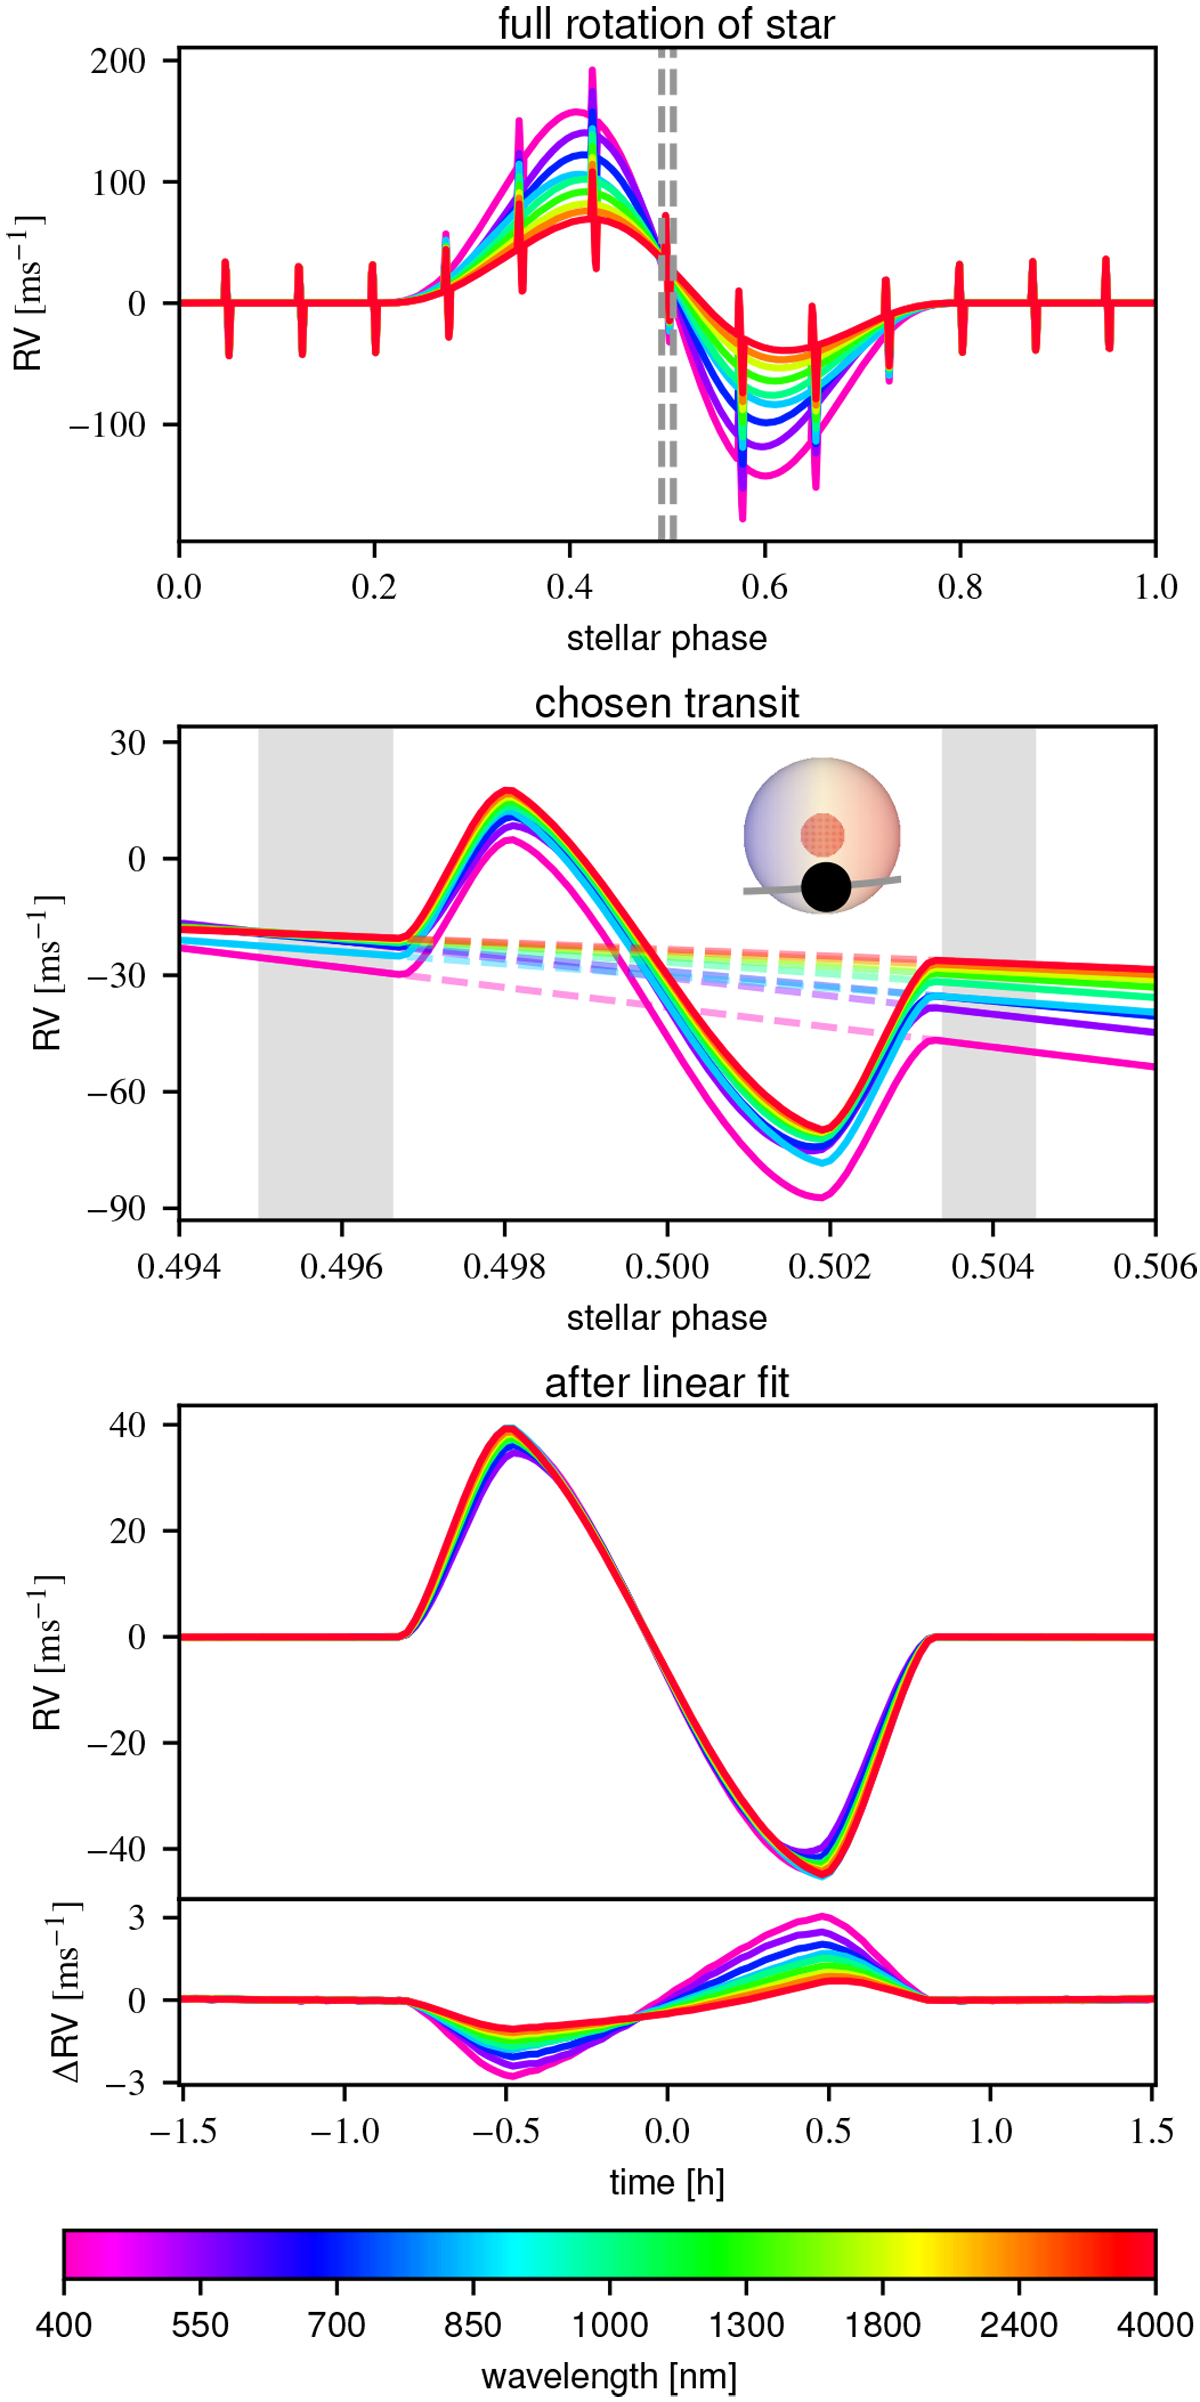
Top: RV variation of the star during one stellar rotation, which exhibits a modulation caused by the presence of a stellar spot. On top of that, the planetary RM signals appear every 0.8 days. We chose ephemeris of the transiting planet in such a way that one of the transit occurs when the stellar spot is at the center of the visible stellar disk (this transit is indicated between two vertical dashed lines). Different colors correspond to different wavelengths as shown in the colorbar. Middle: zoom on the central RM (between two dashed lines in the top panel), and the variation in the out-of-transit RV slope is visible as a function of the wavelength. The gray area shows the regions that are used to remove the out-of-transit slope. Insidethis panel, we illustrate a schematic view of the system, showing the transit chord and position of the active region on the stellar surface. Bottom: RM curves after the underlying slope is removed by performing a linear fit for each individual wavelength. The lower subplot shows the residual between each RM curve with the RM of a planet that transits a quiet star (without any active region).
Current usage metrics show cumulative count of Article Views (full-text article views including HTML views, PDF and ePub downloads, according to the available data) and Abstracts Views on Vision4Press platform.
Data correspond to usage on the plateform after 2015. The current usage metrics is available 48-96 hours after online publication and is updated daily on week days.
Initial download of the metrics may take a while.