Fig. 6.
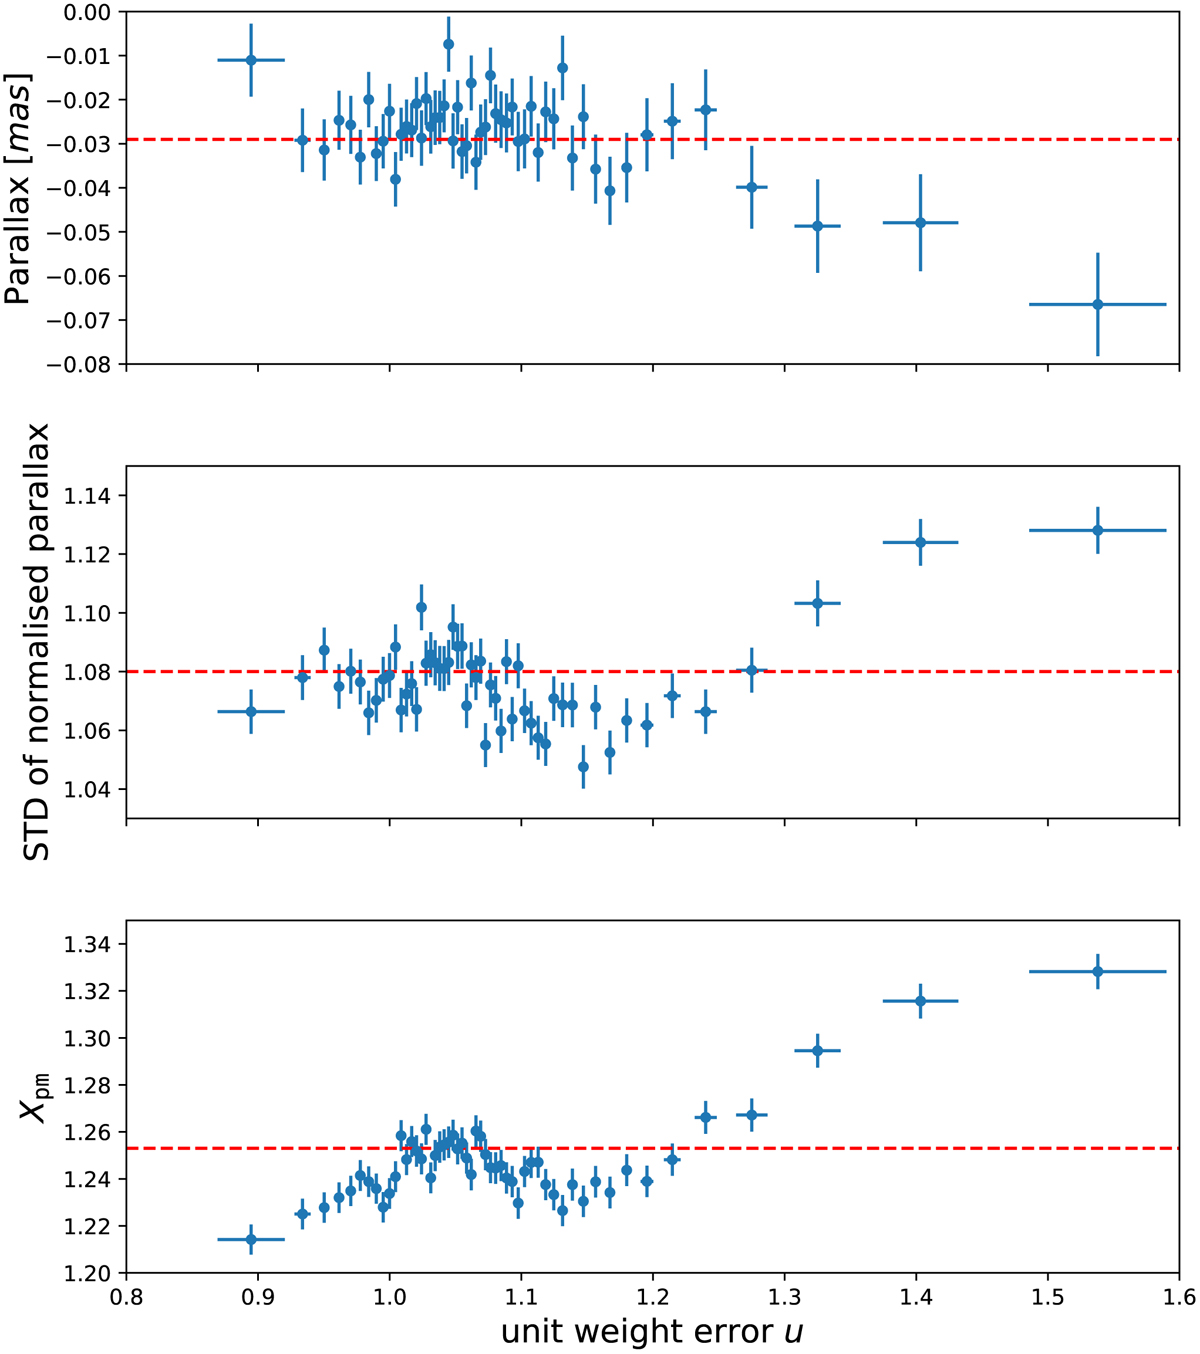
Top: mean values of parallaxes plotted against unit weight error. Middle: standard deviations of the normalised centred parallaxes plotted against the unit weight error. Bottom: mean values of normalised proper motion difference Xpm plotted against the unit weight error. Dashed lines represent the mean values of the full sample. Horizontal error bar represents the standard deviation of the unit weight error in subsets. Sources are sorted by the unit weight error u and divided into subsets. Each dot above is calculated in bins of 10 000 sources. The greatest 16 869 sources are not displayed due to the axis range.
Current usage metrics show cumulative count of Article Views (full-text article views including HTML views, PDF and ePub downloads, according to the available data) and Abstracts Views on Vision4Press platform.
Data correspond to usage on the plateform after 2015. The current usage metrics is available 48-96 hours after online publication and is updated daily on week days.
Initial download of the metrics may take a while.