Fig. 16.
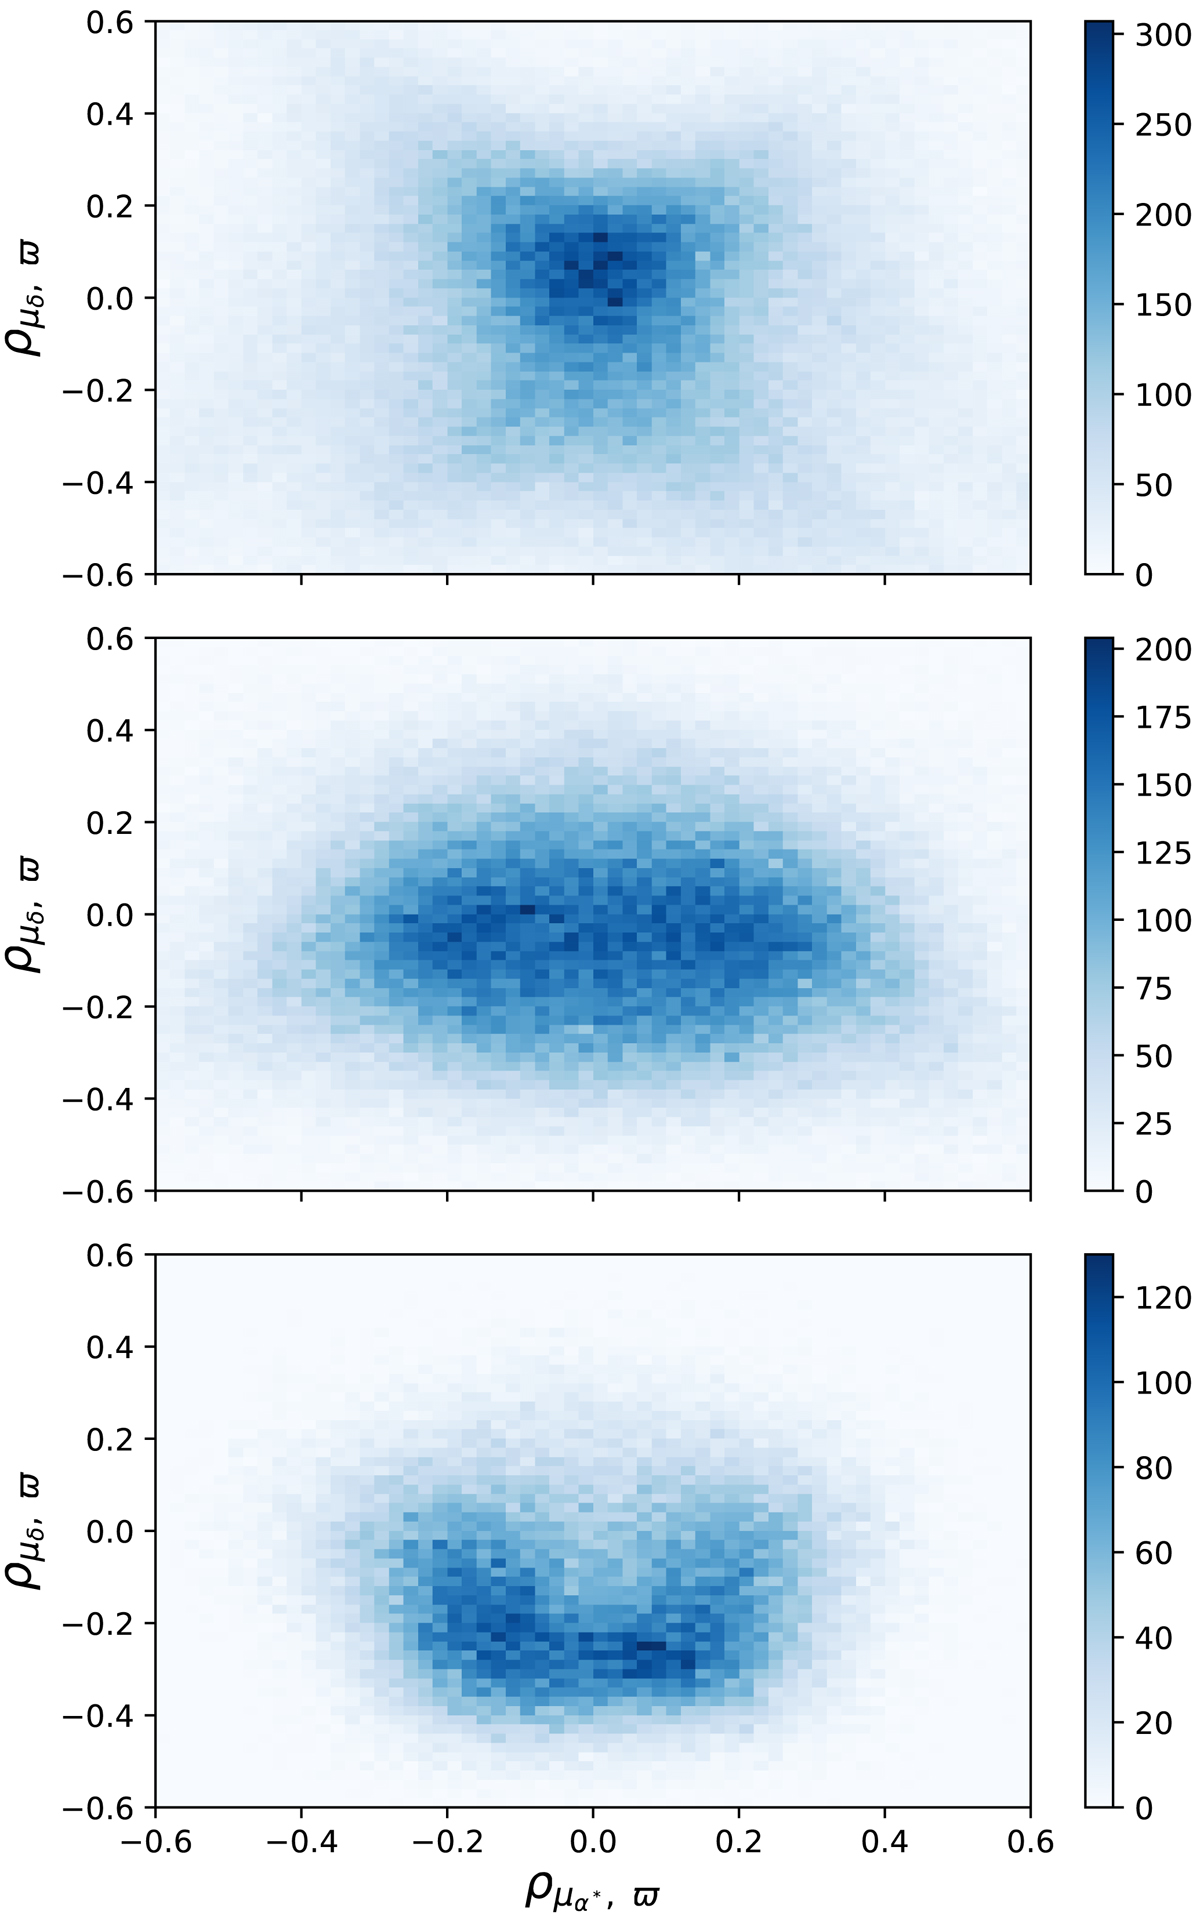
Density map of correlation coefficients, ρμα*, ϖ and ρμδ, ϖ. Top: 232 318 sources with the number of visibility periods under 12. Middle: 169 745 sources with the number of visibility periods in the domain [13, 16]. Bottom: 67 296 sources with the number of visibility periods over 17. The colour bar represents the number of quasars in a pixel.
Current usage metrics show cumulative count of Article Views (full-text article views including HTML views, PDF and ePub downloads, according to the available data) and Abstracts Views on Vision4Press platform.
Data correspond to usage on the plateform after 2015. The current usage metrics is available 48-96 hours after online publication and is updated daily on week days.
Initial download of the metrics may take a while.