Free Access
Fig. 11.
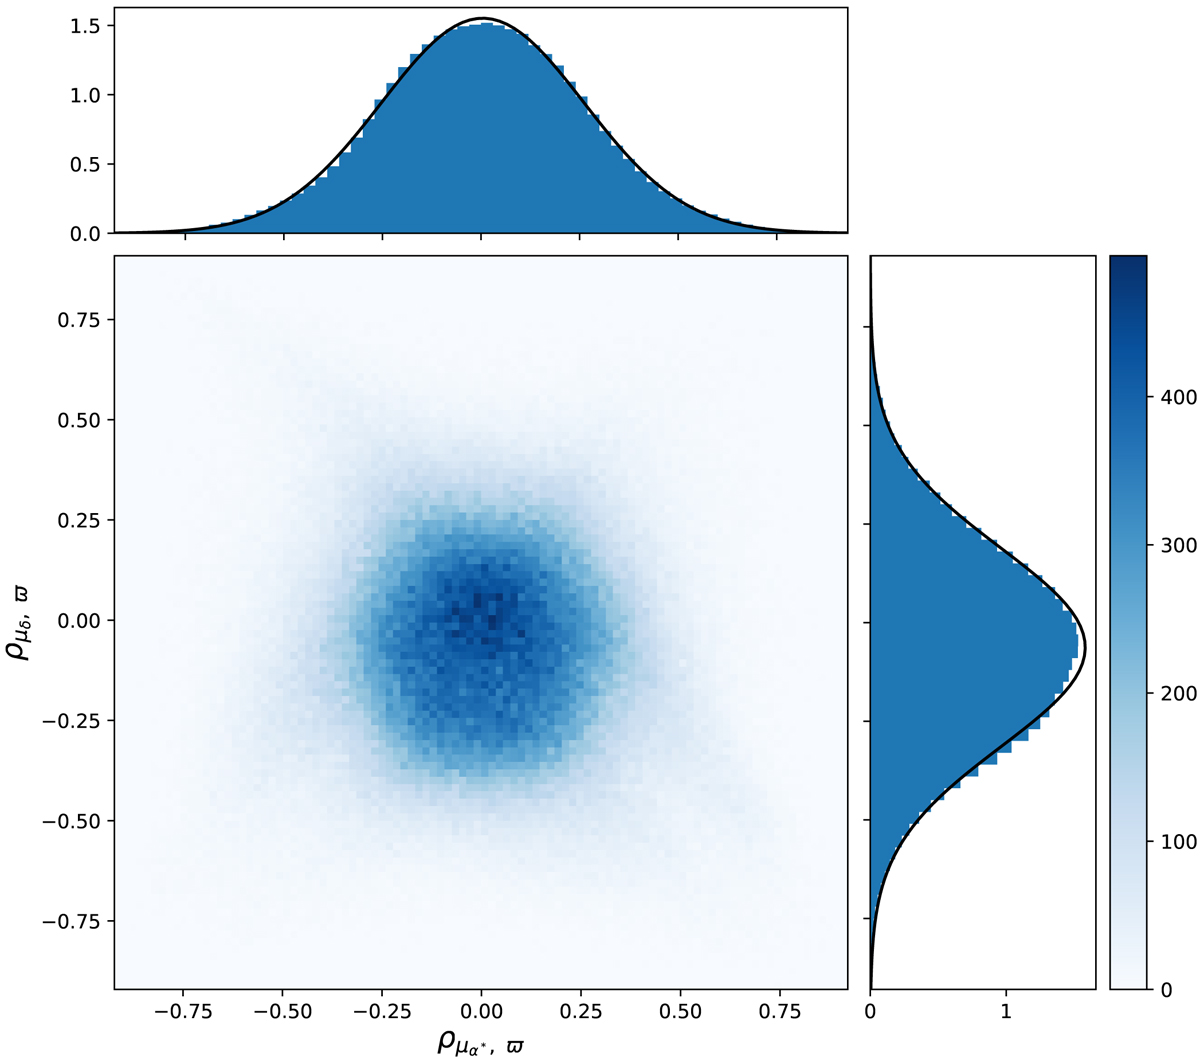
Top and right: probability density histograms of ρμα*, ϖ and ρμδ, ϖ of the full quasar sample, respectively. Bottom: density map of the full quasar sample. The colour bar represents the number of quasars in a pixel. The black curve represents the curve fitting with a Gaussian model.
Current usage metrics show cumulative count of Article Views (full-text article views including HTML views, PDF and ePub downloads, according to the available data) and Abstracts Views on Vision4Press platform.
Data correspond to usage on the plateform after 2015. The current usage metrics is available 48-96 hours after online publication and is updated daily on week days.
Initial download of the metrics may take a while.