Free Access
Fig. 10.
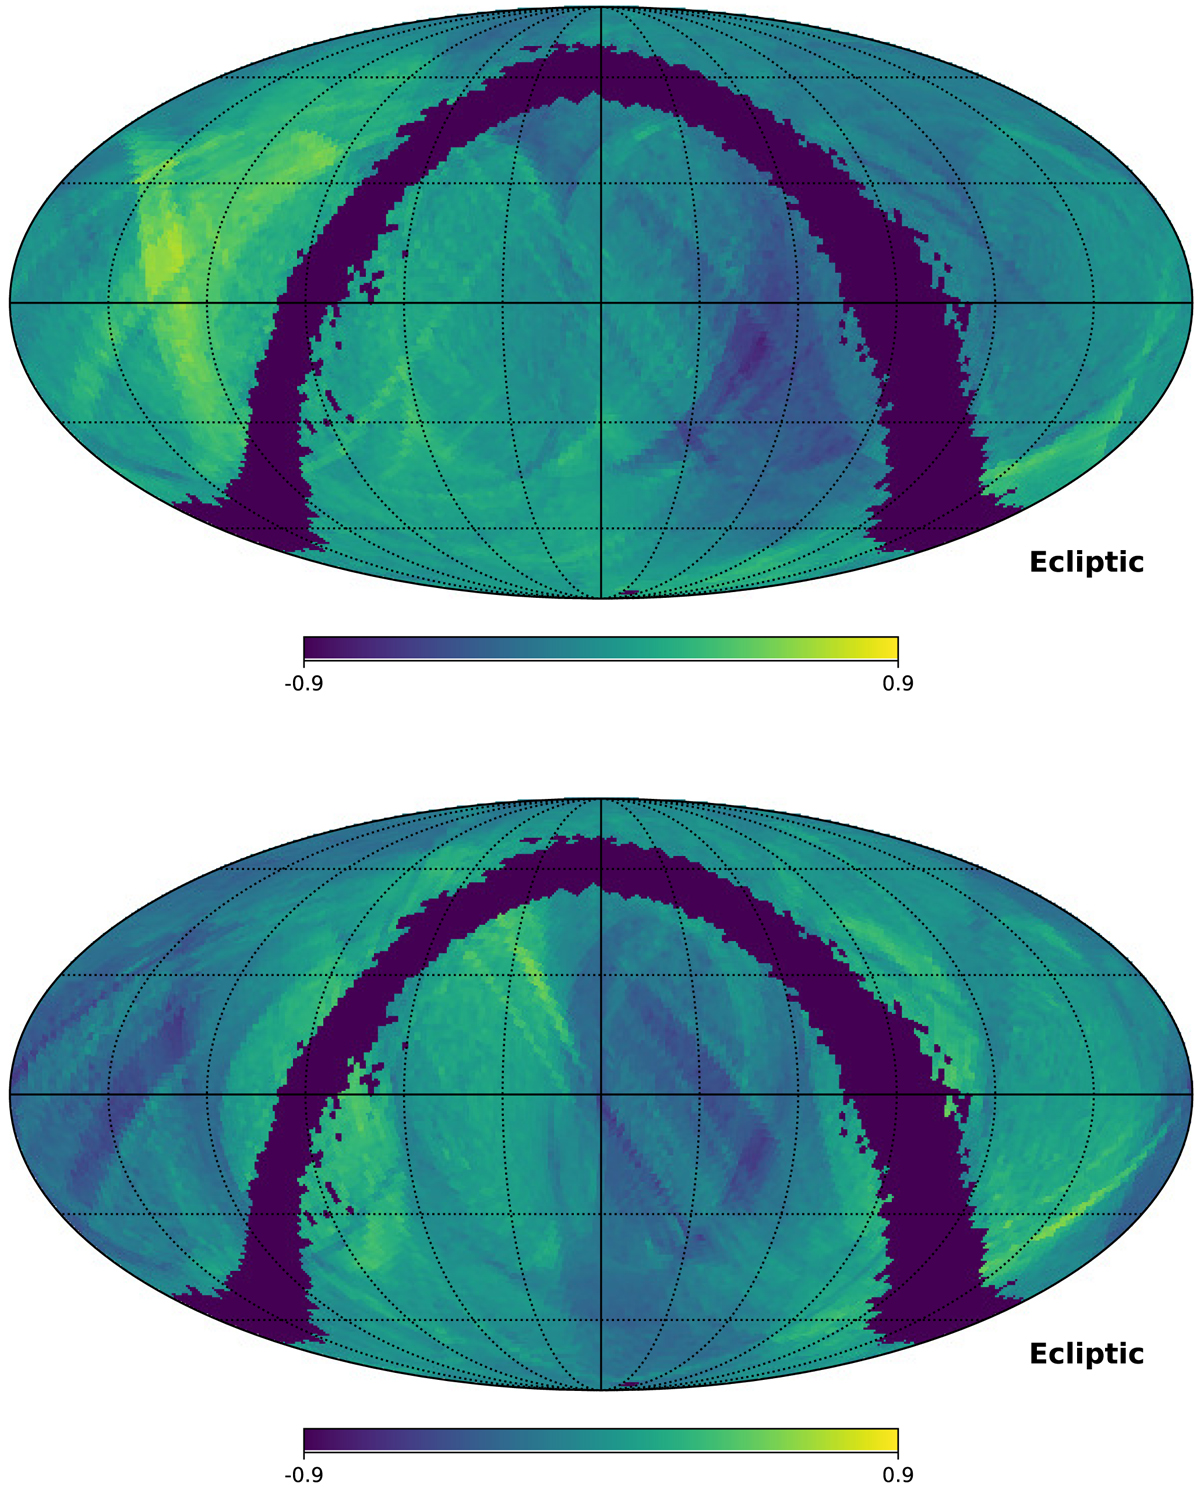
Summary statistics for the full quasar sample. Top: ρμα*, ϖ. Bottom: ρμδ, ϖ. These maps use a Mollweide projection in Ecliptic coordinates. The values are calculated in spherical cells of about 1.8 × 1.8 deg2. Empty cells as well as cells with sources no more than 10 are shown in dark blue.
Current usage metrics show cumulative count of Article Views (full-text article views including HTML views, PDF and ePub downloads, according to the available data) and Abstracts Views on Vision4Press platform.
Data correspond to usage on the plateform after 2015. The current usage metrics is available 48-96 hours after online publication and is updated daily on week days.
Initial download of the metrics may take a while.